October 27, 2014
In February 2012, we review the six world major indices five years weekly chart. Now we would like to review the same six world major indices five years weekly chart here again. See below for details.
The five year weekly indexes from October 2010 for the following six world major indices.
- S&P 500, Standard & Poor’s 500 stock market index,
- NASDAQ, National Association of Securities Dealers Automated Quotations, American stock exchange,
- DJI, Dow Jones Industrial Index,
- HSI, Hang Seng Bank Index for Hong Kong stock exchange,
- Nikkei 225, or Nikkei Index, for Tokyo stock exchange,
- STI, Straits Times Index, Singapore stock market benchmark
Chart worth a thousand words. What the chart tells you so far?
1) S&P 500, Standard and Poor’s 500 Index.
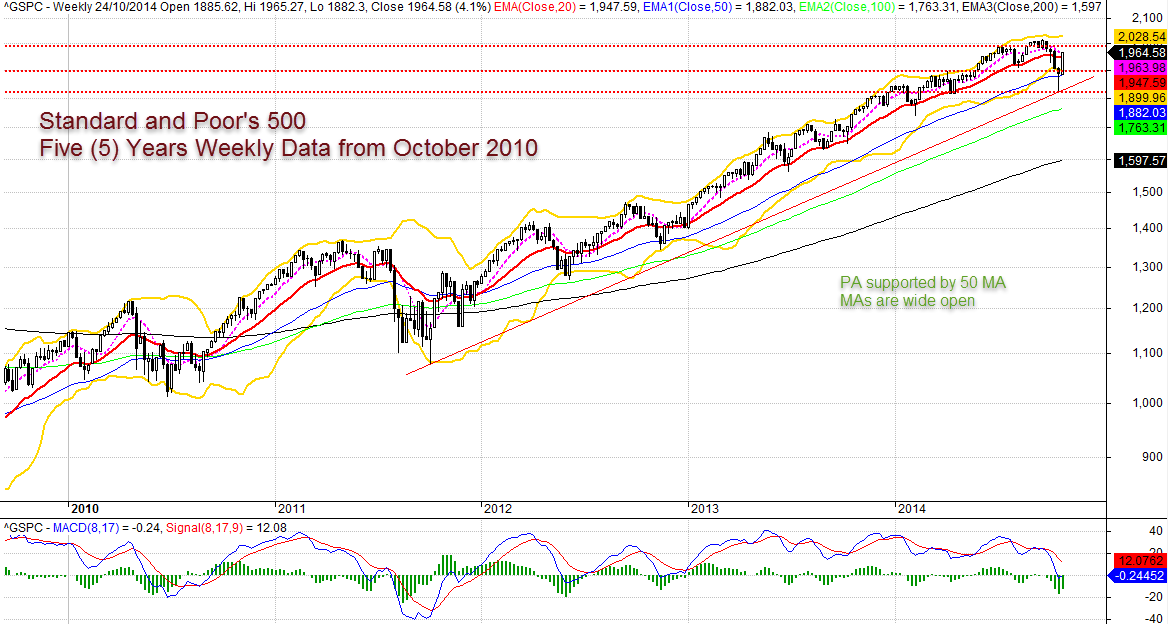
Five (5) Years Weekly Data from October 2010, S&P 500, Standard & Poor’s 500 Stock Market Index, ^GSPC
.
2) NASDAQ, National Association of Securities Dealers Automated Quotations, American Stock Exchange.
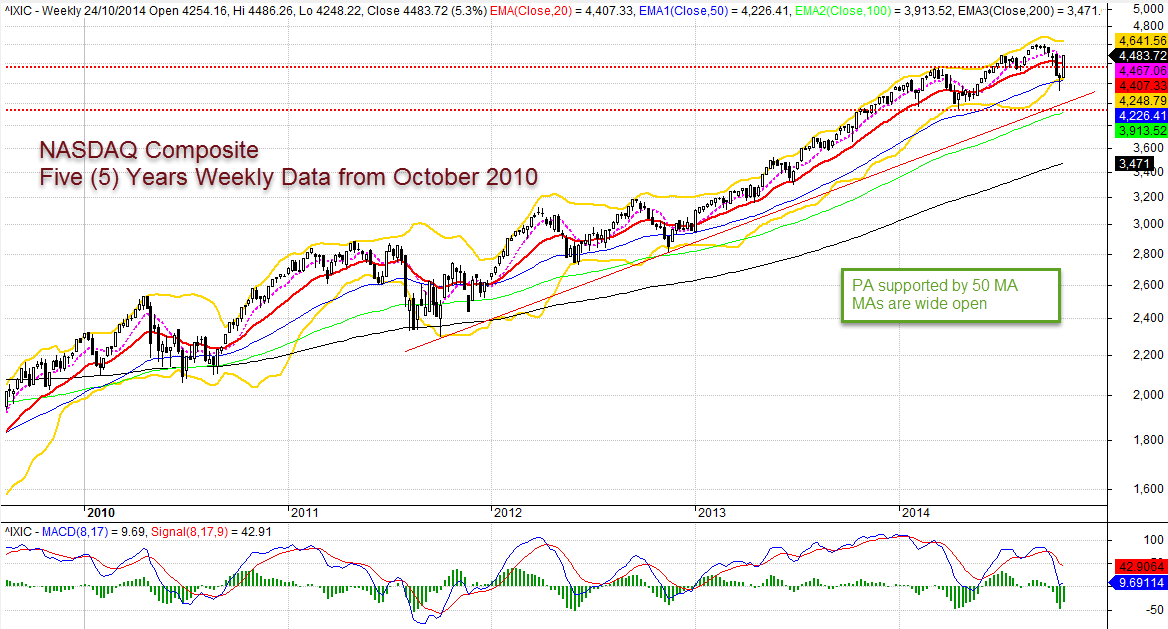
Five (5) Years Data Weekly NASDAQ from October 2010
3) DJI, Dow Jones Industrial Index.
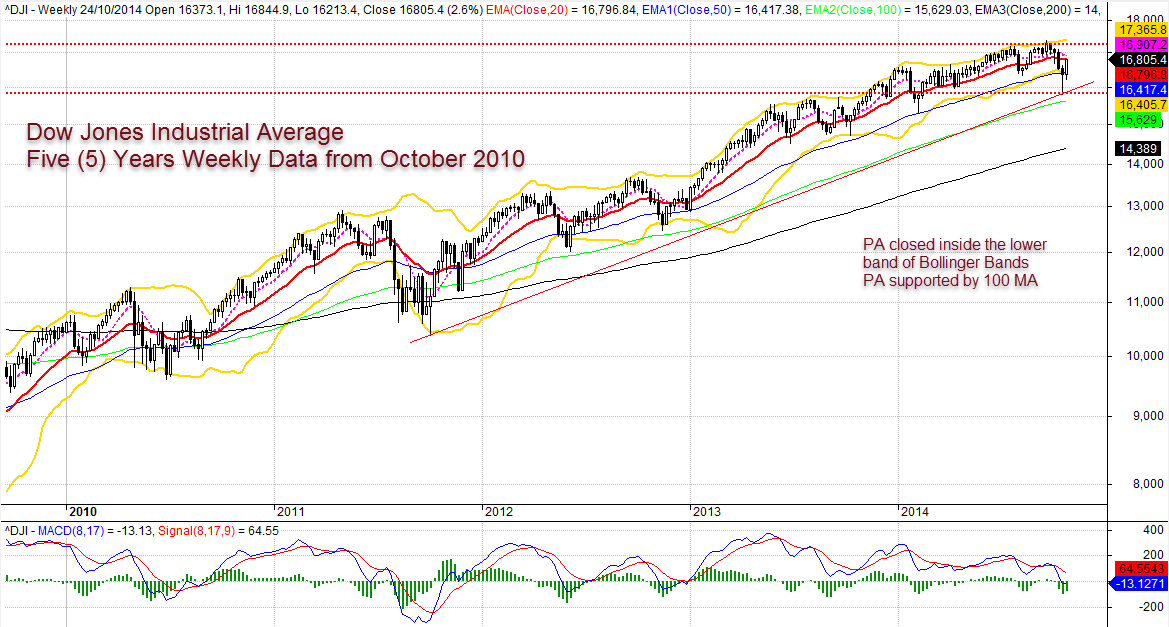
Five (5) Years Weekly Data from October 2010 DJI, Dow Jones Industrial Index,
4) HSI, Hang Sang Bank Index for Hong Kong Stock Exchange.
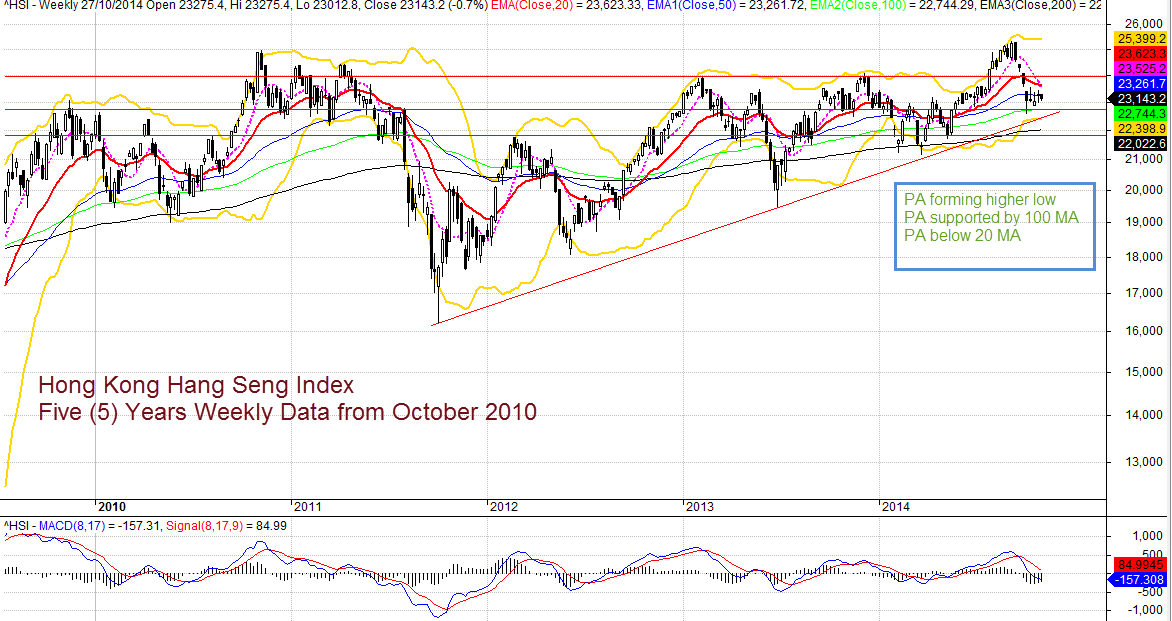
Five Years Weekly Data from October 2010, Hong Kong Hang Sang Index, HSI
5) Nikkei 225, or Nikkei Index, for Tokyo Stock Exchange.
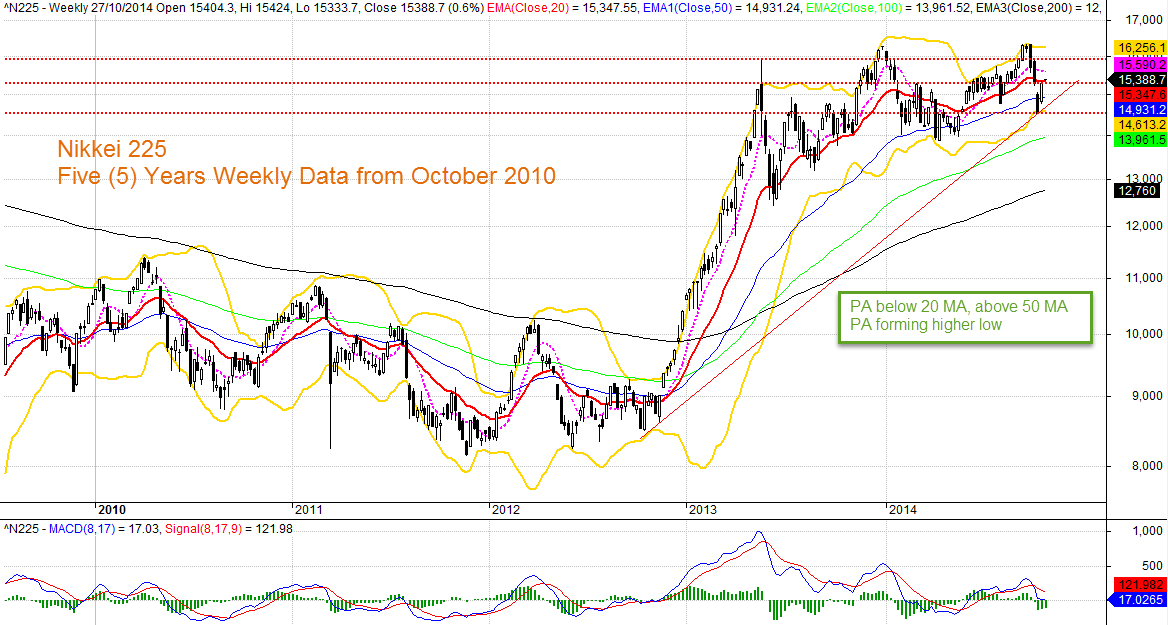
Five (5) Years Weekly Data from October 2010 for Nikkei 225
6) STI, Straits Times Index, Singapore Stock Market Benchmark.
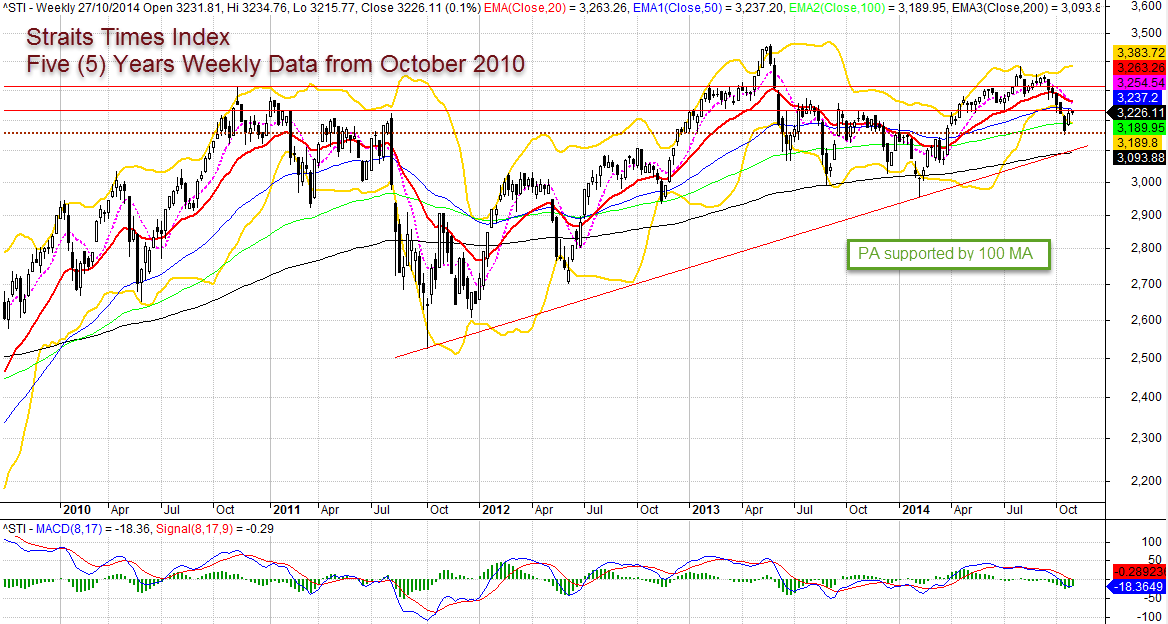
Five (5) Weekly Data from October 2010 for Singapore Stocks, Straits Times Index, STI
Other postings.
1) Moses’s Stock Corner – Six World Major Indices Five Years Weekly Chart
2) images
3) US Markets as a Leading Indicator? STI
4) Moses Stock Analysis – Compare Asia Major Markets and Great Recession of 2008 – 2009
5) Moses Stock Analysis – Technical Analysis on Asia Key Markets on Great Recession of 2008 – 2009
6) Moses’ Stock Review Thought and Notes of Trading – compare major market indexes
Thanks for visiting the site, AmiBrokerAcademy.com.
Moses
DISCLAIMER
Information provided here is of the nature of a general comment only and no intend to be specific for trading advice. It has prepared without regard to any particular investment objectives, financial situation or needs. Information should NOT be considered as an offer or enticement to buy, sell or trade.
You should seek advice from your broker, or licensed investment advisor, before taking any action.
Once again, the website does not guarantee any results or investment return based on the information and instruction you have read here. It should be used as learning aids.
Trading is personal. You are responsible for your own trading decision.
The comment is the author personal experience. There is no intent for your believe and follow.