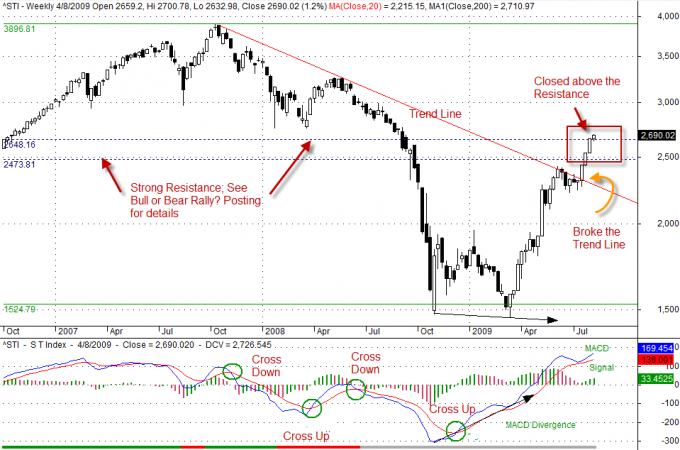
Up or Down? Yesterday (August 3, 2009), Singapore Straits Times Index closed 2690.02, a (twenty two) 22% higher than the last high.
Question? Can you plan your move? Yes, you can. Using powerful stock charting software and apply Technical Analysis (TA), you can analysis, plan your trade and trade your plan. This is what a professional trader does for his living. So can you? Yes, get a powerful charting software like AmiBroker and learn the TA. Practice, Practice and Practice, soon you can start plan your trade and trade your plan.
You may ask, can I use other charting software? Of course you can. As long as the charting software support those functions that you need and the data you require.
The advantages of using AmiBroker are you can save your study. In other words, you can save your lines, comments and analysis you made on your chart for future review and analysis again. You can save your portfolio using watchlist. You can review your watchlist and plan off-line without having to log in to your system, such as brokers’ platform. You can do it at anytime, anywhere as long as you have all the data download to your notebook. Besides that you are using one single system for all your brokers, as many of us maintain more than one broker for just in case. Therefore, many may recreate your study on all your brokers’ platform. This is unproductive. It creates inconsistency too, as not all brokers platform support the same functions or can save your study.
See enclosed chart for what you can plan for your trade using Singapore Straits Times Index, STI as an example. See yesterday posting Bull or Bear Rally? for more information.
Definition:
What is Support and Resistance? Support is found where price falls to this level, but then falls no further. Resistance is found where price rises to this level, but then rises no further.
What is Strong Support and Resistance? The more times the prices bounces off support and falls back from resistances, the stronger Support and Resistance levels become.
MACD, stands for Moving Average Convergence Divergence.

Disclaimer:
The information are not meant to be used for buy or sell decision. We do not recommend particular stocks, bonds, options, futures and any securities of any kind. If particular stocks of such are mentioned, they are meant as demonstration of Amibroker as a powerful charting software and the important of Technical Analysis. The information convey here is intended to provide you with basic information, methods, and strategies as education purpose. You should seek for a professional course to learn Technical Analysis. There are many other factors to be considered such as wait for market to show hands. Users must understand what Technical Analysis is all about before using it. Once again, the website does not guarantee any results or investment return based on the information and instruction you have read here.
