Do you know its a Bull or Bear rally?
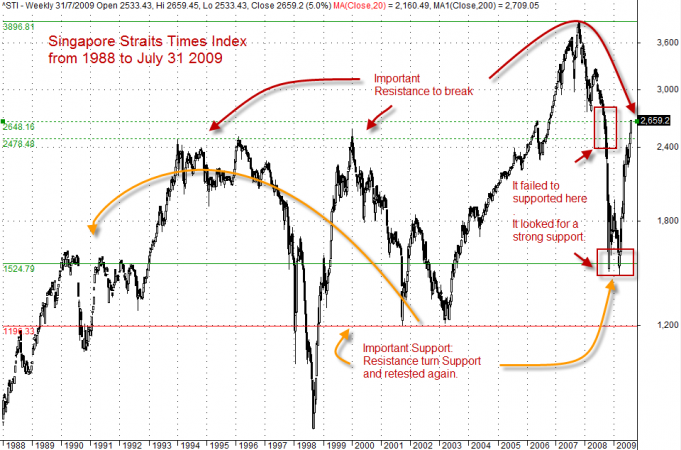
Stock markets have rocketed up, and many are rejoicing. Are the gains transient? Can it be sustainable? A trend remains to be seen. Singapore Straits Times Index (STI, or ST Index) has climbed from 1485, from March 10, 2009 to 2659, July 31, 2009. a 1179 points higher a short (near) five months.
Other than the fundamental and many uncertainty, from the Technical Analysis, there is a critical resistance to be broken and stay broken. The index has to close up above the resistance to confirm the break. However, it require strength too to stay above the resistance and keep pushing up. Otherwise, the resistance may turn support (later). See chart for details.
Disclaimer:
The information are not meant to be used for buy or sell decision. We do not recommend particular stocks, bonds, options, futures and any securities of any kind. If particular stocks of such are mentioned, they are meant as demonstration of Amibroker as a powerful charting software and the important of Technical Analysis. The information convey here is intended to provide you with basic information, methods, and strategies as education purpose. You should seek for a professional course to learn Technical Analysis. There are many other factors to be considered such as wait for market to show hands. Users must understand what Technical Analysis is all about before using it. Once again, the website does not guarantee any results or investment return based on the information and instruction you have read here.

