July 1, 2017
MACD Cross Down Singal! F34 Wilmar International
The price action after the peak in start of 2017, the price action fail the retest the high. The price action begin to drift south, now the price action had break the key level resistance turns support. Again the price try to retest the key level, and again fail. Now the price has broken the the 2017 low. The low was tested, and retested, total three times. Now the price action has close below it.
We can see the price action has finally breakout below two months low; it breakout got to be strong, or quite strong.
Picture worth a thousand words, You could also see a MACD cross down signal. So!?
MACD signals adds the directional sense. But, trade what you see and not what you think! Okay?
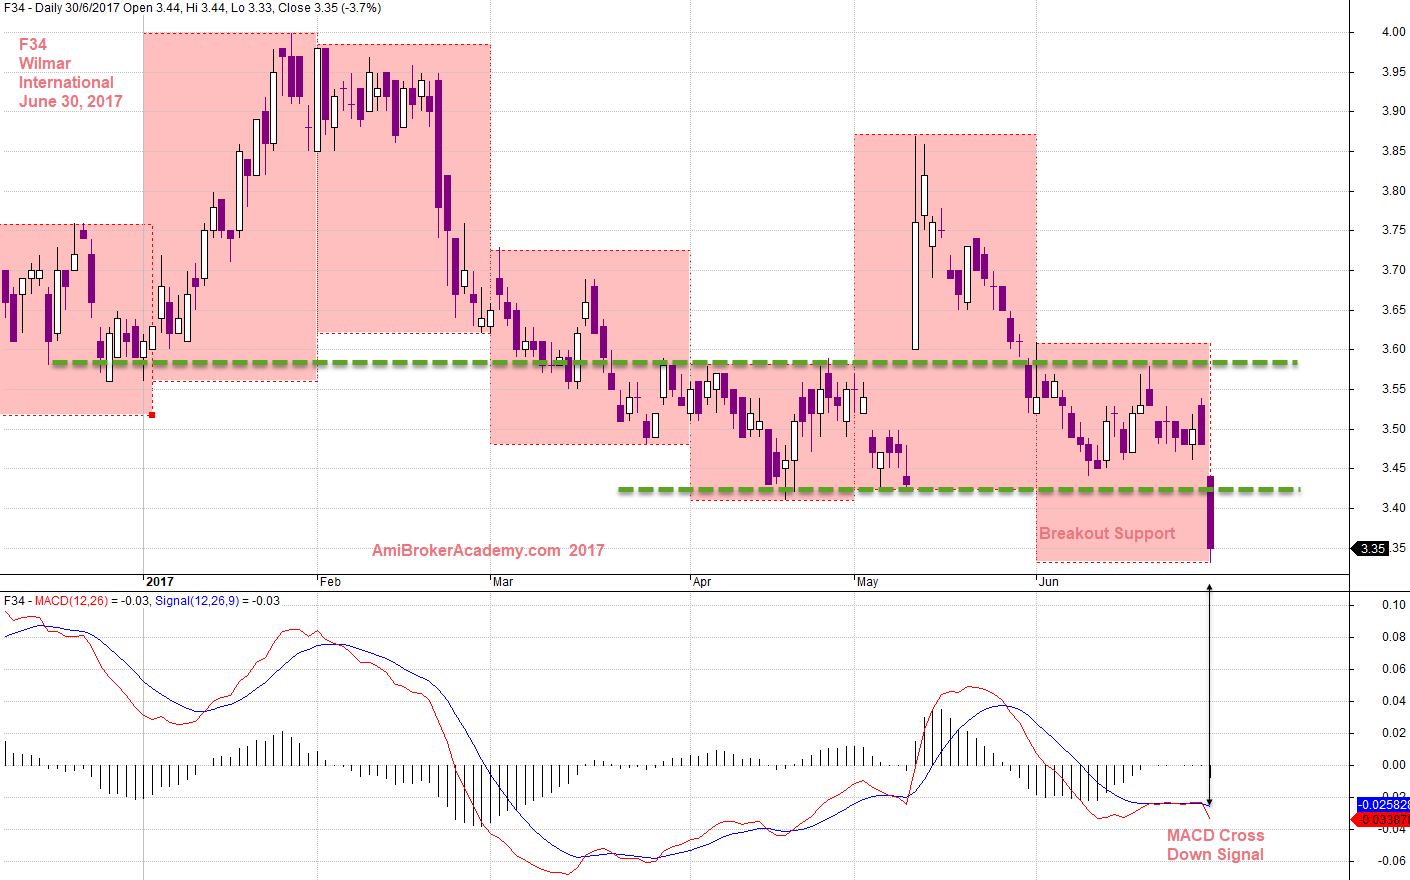
June 30, 2017 Wilmar International and Support Resistance
Moses Stock Analysis
AmiBrokerAcademy.com
Disclaimer
The above result is for illustration purpose. It is not meant to be used for buy or sell decision. We do not recommend any particular stocks. If particular stocks of such are mentioned, they are meant as demonstration of Amibroker as a powerful charting software and MACD. Amibroker can program to scan the stocks for buy and sell signals.
These are script generated signals. Not all scan results are shown here. The MACD signal should use with price action. Users must understand what MACD and price action are all about before using them. If necessary you should attend a course to learn more on Technical Analysis (TA) and Moving Average Convergence Divergence, MACD.
Once again, the website does not guarantee any results or investment return based on the information and instruction you have read here. It should be used as learning aids only and if you decide to trade real money, all trading decision should be your own.