7 August, 2018
Singapore Stock Stories
H17 Hi-P International Charting
See chart, picture worth a thousand words. Study Hi P International, H17 stock price. See stock chart. The price action after the peak continue to move lower. Now at the bottom of 2018. Retest the low again and become lower.
What will the the price action like for the next few days or weeks or maybe months? Will the stock price move even more low? Monitor the stock price.
The stock price has been on the sideways after the breakout. The whole July the price action just trapped in a box. See chart.
Manage your risk.
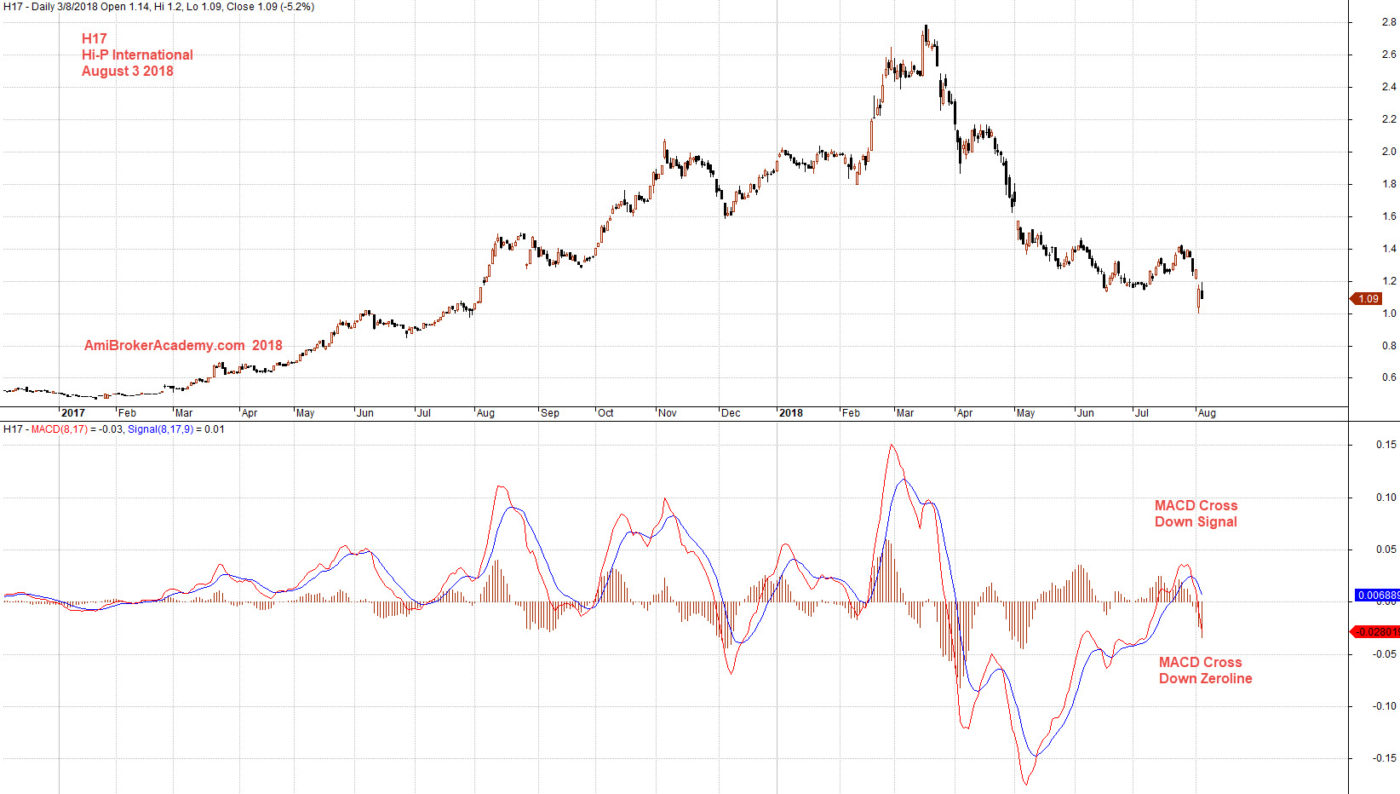
August 3, 2018 Hi-P International and MACD
Manage your trade and risk.
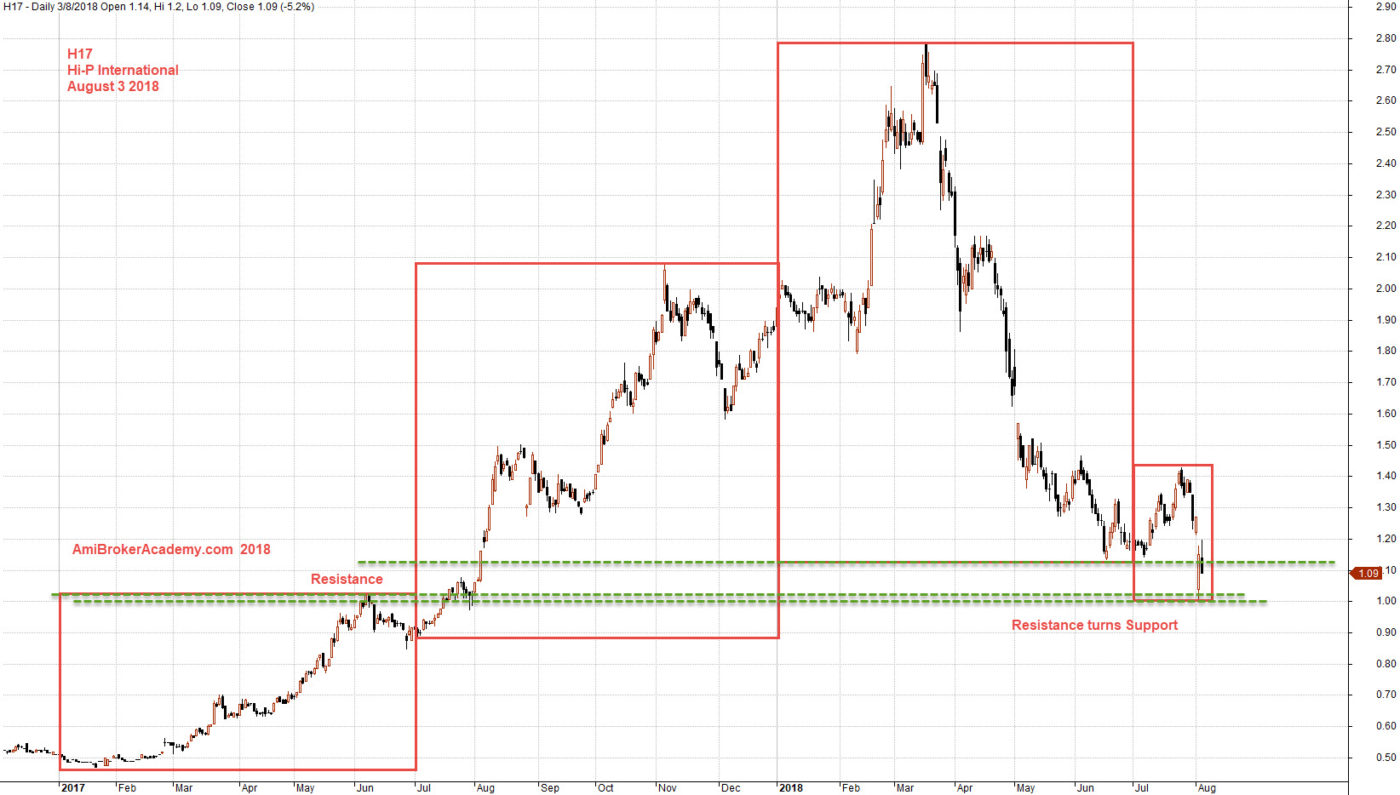
H17 Hi-P International Charting
Add the boxes for easy reference and analysis. We see Hi-P continue to have high top, But the last six months low closes to the previous six month low. This forms a strong support. If you extent the level further, you will also spot the level is the previous previous six months resistance. So, resistance turn support. This got to be a very strong level.
Now, remember why we trade? To make money or a lot of money. So, one strategy is to buy low and and sell high. Buy low and Sell high is also lower risk, as the stop is nearer to the buy price.
So, see if we can find the good justification to buy near 1.20 and sell at next strong level, may be 2. It is good profit.
Trade with eyes open and manage your risk.
August 3, 2018 Hi-P International and Six Months High Low
Moses
AmiBrokerAcademy.com
Disclaimer
The above result is for illustration purpose. It is not meant to be used for buy or sell decision. We do not recommend any particular stocks. If particular stocks of such are mentioned, they are meant as demonstration of Amibroker as a powerful charting software and MACD. Amibroker can program to scan the stocks for buy and sell signals.
These are script generated signals. Not all scan results are shown here. The MACD signal should use with price action. Users must understand what MACD and price action are all about before using them. If necessary you should attend a course to learn more on Technical Analysis (TA) and Moving Average Convergence Divergence, MACD.
Once again, the website does not guarantee any results or investment return based on the information and instruction you have read here. It should be used as learning aids only and if you decide to trade real money, all trading decision should be your own.