July 23, 2018
Singapore Stock Stories
F99 Fraser and Neave Charting and Stochastic
See chart, picture worth a thousand words. Study Fraser and Neave of F&N stock price chart. See stock price and Stochastic. The overbought and the peak of the stock. The more important of the chart is to look at the oversold. As the slow stochastic is in the oversold zone for a long period of time. The price action has be on the bearish trend. Look left you will notice the price action after breakout from the 2017 second half low the stochastic has already in the oversold region. Now see the power of the Stochastic. It signals you the trend.
Manage your risk.
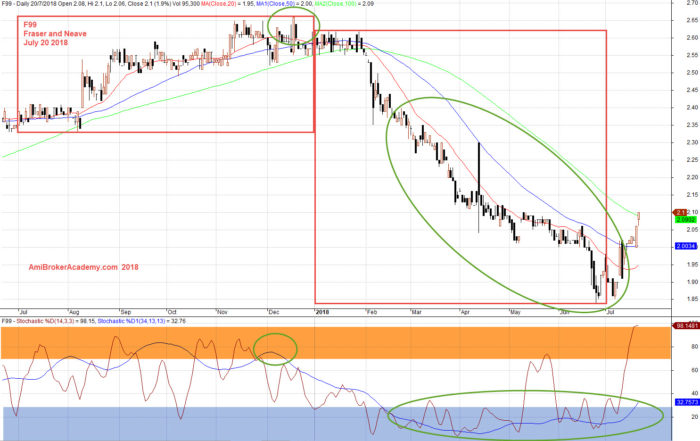
July 20, 2018 Fraser and Neave and Stochastic
Moses
AmiBrokerAcademy.com
Disclaimer
The above result is for illustration purpose. It is not meant to be used for buy or sell decision. We do not recommend any particular stocks. If particular stocks of such are mentioned, they are meant as demonstration of Amibroker as a powerful charting software and MACD. Amibroker can program to scan the stocks for buy and sell signals.
These are script generated signals. Not all scan results are shown here. The MACD signal should use with price action. Users must understand what MACD and price action are all about before using them. If necessary you should attend a course to learn more on Technical Analysis (TA) and Moving Average Convergence Divergence, MACD.
Once again, the website does not guarantee any results or investment return based on the information and instruction you have read here. It should be used as learning aids only and if you decide to trade real money, all trading decision should be your own.