July 16, 2018
Singapore Stock Stories
D01 Daily Farm International Charting
See chart, picture worth a thousand words. Study Daily Farm International stock price chart. See the half year performance for reference for the next six months trade plan.
Manage your risk.
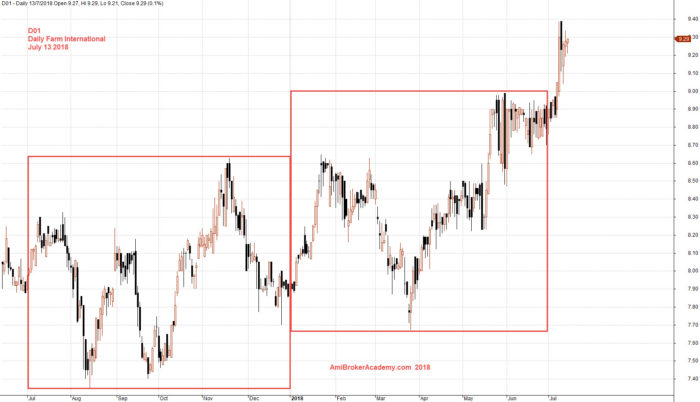
July 13, 2018 Daily Farm International and Half Year Performance
D01 Daily Farm International Charting and Resistance Zone
See chart, picture worth a thousand words. See price action breakout from the resistance zone. Manage your rsik.
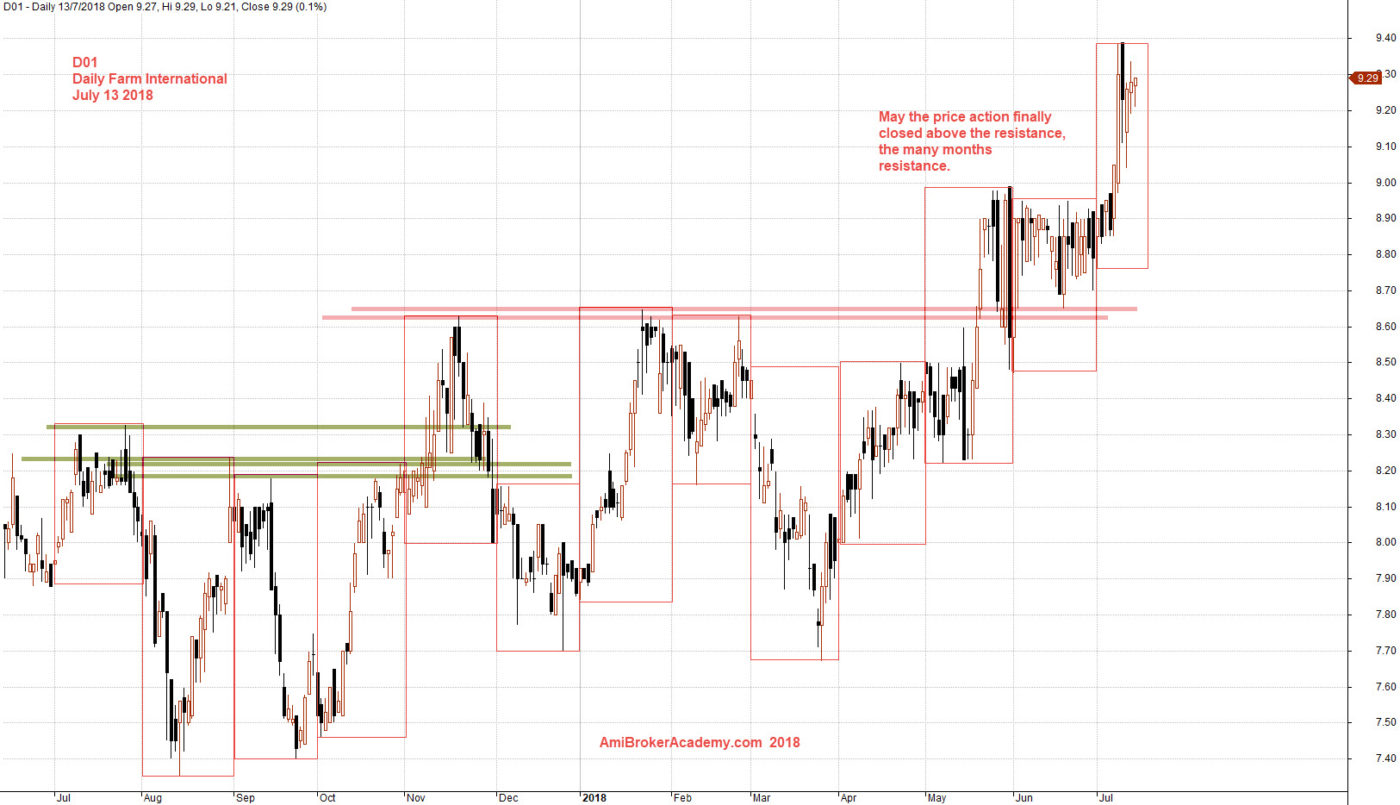
July 13, 2018 Daily Farm International Resistance Zone and Breakout
Moses
AmiBrokerAcademy.com
Disclaimer
The above result is for illustration purpose. It is not meant to be used for buy or sell decision. We do not recommend any particular stocks. If particular stocks of such are mentioned, they are meant as demonstration of Amibroker as a powerful charting software and MACD. Amibroker can program to scan the stocks for buy and sell signals.
These are script generated signals. Not all scan results are shown here. The MACD signal should use with price action. Users must understand what MACD and price action are all about before using them. If necessary you should attend a course to learn more on Technical Analysis (TA) and Moving Average Convergence Divergence, MACD.
Once again, the website does not guarantee any results or investment return based on the information and instruction you have read here. It should be used as learning aids only and if you decide to trade real money, all trading decision should be your own.