May 5, 2018
We have studied OCBC, and DBS bank stock price. Let see what UOB has to say for their stock price.
Singapore Stock Analysis
U11 United Overseas Bank and EMA Wave
Study United Overseas Bank local bank stock price using Moving Average. Instead of using one MA, we use three, low, high and close MA. See chart below, we use 34 EMA. We call this band as river or wave. Picture worth a thousand words, see chart for more. The stock price mainly bouncing above MAs. Only until 2018, the price action begin to close below the MA band, and cross up again. Finally, the stock price close above MA band. See chart, the river is pointing at one o’clock direction. Bullish. Don’t buy high and try to sell higher. See any opportunity to buy low and sell high. So, wait and manage your risk.
Manage your risk.
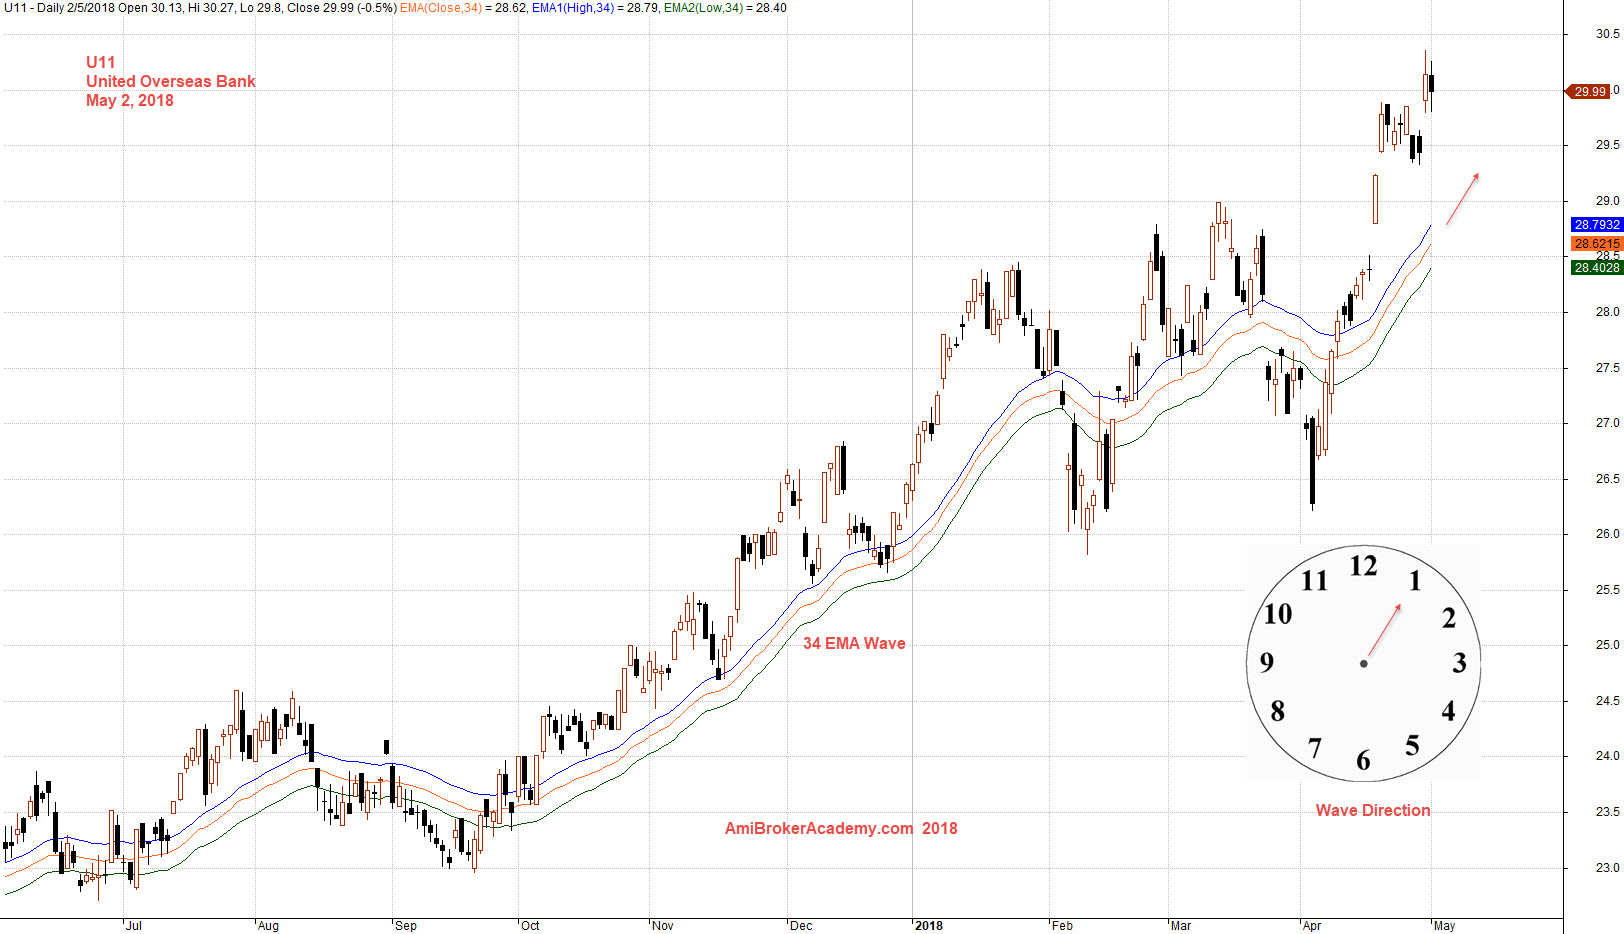
May 2, 2018 United Overseas Bank and EMA Wave
Moses Singapore Stock Analysis
AmiBrokerAcademy.com
Disclaimer
The above result is for illustration purpose. It is not meant to be used for buy or sell decision. We do not recommend any particular stocks. If particular stocks of such are mentioned, they are meant as demonstration of Amibroker as a powerful charting software and MACD. Amibroker can program to scan the stocks for buy and sell signals.
These are script generated signals. Not all scan results are shown here. The MACD signal should use with price action. Users must understand what MACD and price action are all about before using them. If necessary you should attend a course to learn more on Technical Analysis (TA) and Moving Average Convergence Divergence, MACD.
Once again, the website does not guarantee any results or investment return based on the information and instruction you have read here. It should be used as learning aids only and if you decide to trade real money, all trading decision should be your own.