June 24, 2017
Singapore Stock Stories
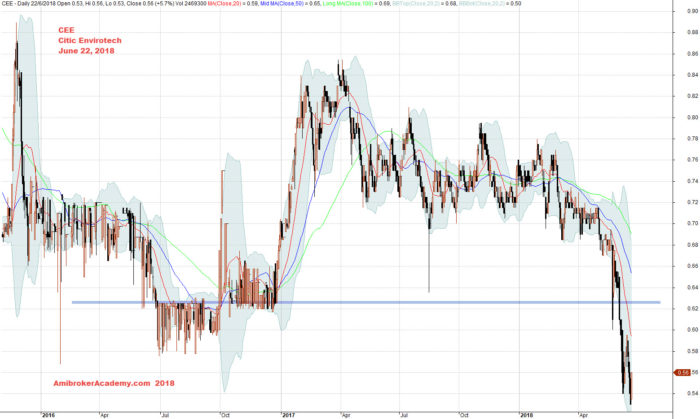
CEE Citic Envirotech Stock Charting
See chart, picture worth a thousand words. Study Citic Envirotech stock price charting. Citic Envirotech after the peak higher than 88 cents in 2015 the price action went to low at 58 cents in 2016.. The stock price action test the high near 86 cents in 2017. Since then the price action just continue to form lower low and lower high. Finally the price action has breakout below 62 cents. At this point, forget about try to catch the falling knife. There is no sign of rebounce in the near term. next week or next next week. Wait, is the strategy. Trade with eyes open. Until you see bullish pattern, then you consider to enter the buy trade.
Again, trade with eyes open.
Manage your risk.
June 22, 2018 Citic Envirotech and Charting
CEE Citic Envirotech Stock Charting and MACD
Picture worth a thousand words, see chart.
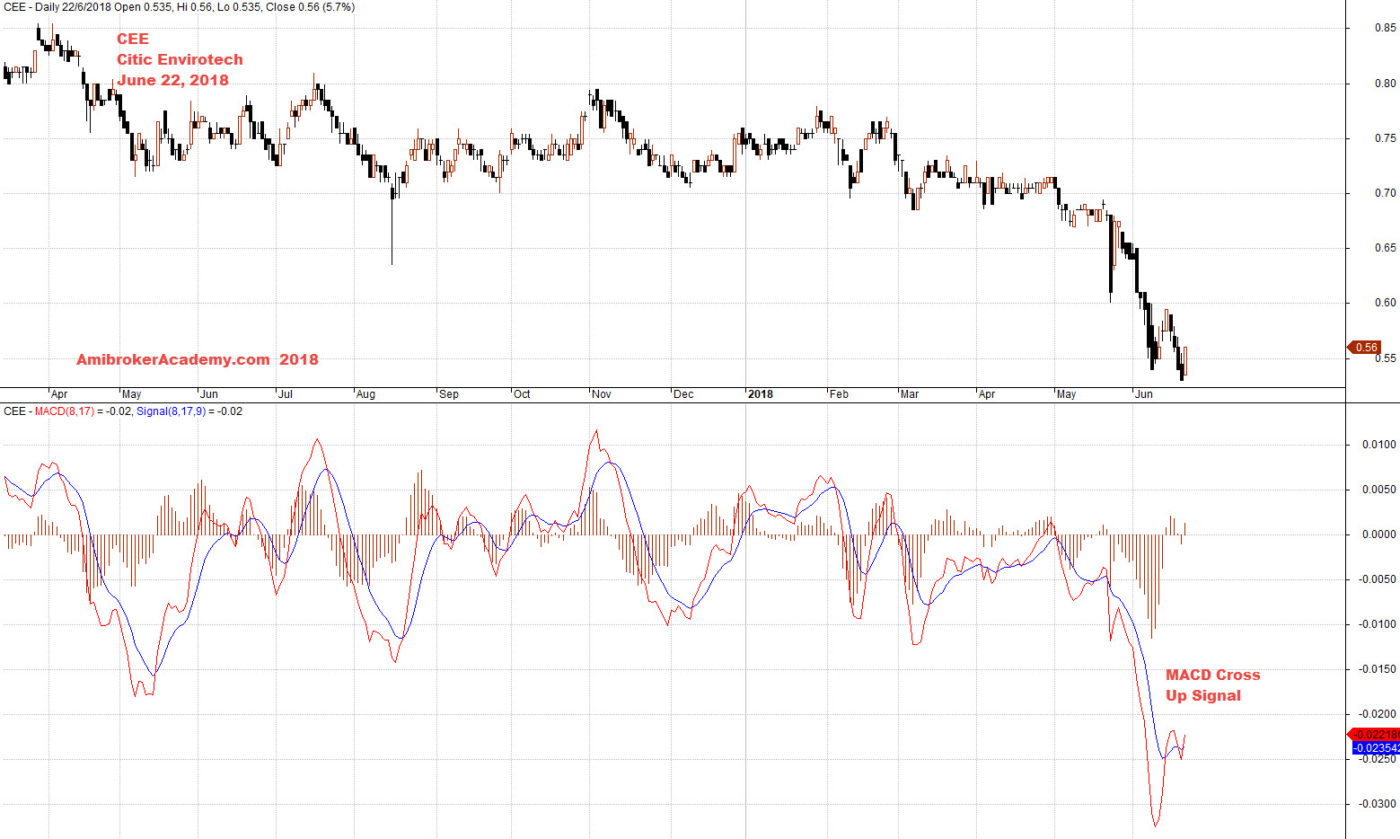
June 22, 2018 Citic Envirotech and MACD
Moses
AmiBrokerAcademy.com
Disclaimer
The above result is for illustration purpose. It is not meant to be used for buy or sell decision. We do not recommend any particular stocks. If particular stocks of such are mentioned, they are meant as demonstration of Amibroker as a powerful charting software and MACD. Amibroker can program to scan the stocks for buy and sell signals.
These are script generated signals. Not all scan results are shown here. The MACD signal should use with price action. Users must understand what MACD and price action are all about before using them. If necessary you should attend a course to learn more on Technical Analysis (TA) and Moving Average Convergence Divergence, MACD.
Once again, the website does not guarantee any results or investment return based on the information and instruction you have read here. It should be used as learning aids only and if you decide to trade real money, all trading decision should be your own.