June 19, 2017
Singapore Stock Stories
5TS Alpha Energy Holdings Stock Charting
See chart, picture worth a thousand words. Study Alpha Energy Holdings stock price charting. From 2012, the price action eventually went from IPO 30 plus cent to near double of 70 cents. But the price action can not stay at the level or even move higher. The price action had a near vertical movement to the peak and take a bit more time to drift down to nearly half of IPO, 15 cents. The stock price spent six plus years to move up and move down.
Trade with eyes open. Listing sometimes is like fashion. When others company IPO, some company also IPO. So, be aware.
Manage your risk.
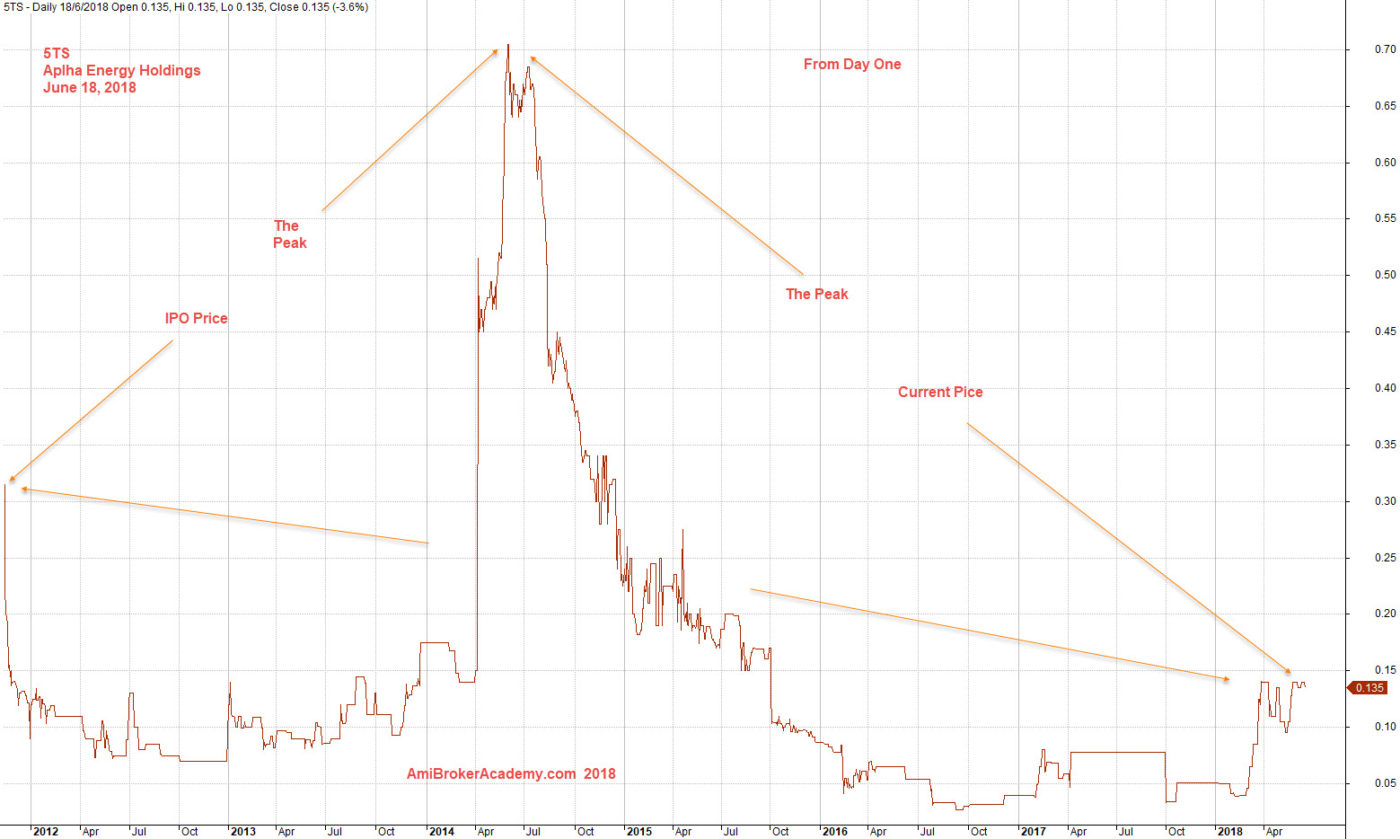
June 18, 2018 Alpha Energy Holdings Charting
Moses
AmiBrokerAcademy.com
Disclaimer
The above result is for illustration purpose. It is not meant to be used for buy or sell decision. We do not recommend any particular stocks. If particular stocks of such are mentioned, they are meant as demonstration of Amibroker as a powerful charting software and MACD. Amibroker can program to scan the stocks for buy and sell signals.
These are script generated signals. Not all scan results are shown here. The MACD signal should use with price action. Users must understand what MACD and price action are all about before using them. If necessary you should attend a course to learn more on Technical Analysis (TA) and Moving Average Convergence Divergence, MACD.
Once again, the website does not guarantee any results or investment return based on the information and instruction you have read here. It should be used as learning aids only and if you decide to trade real money, all trading decision should be your own.