December 24, 2018
Think think got more things.
Thanks for visiting the site.
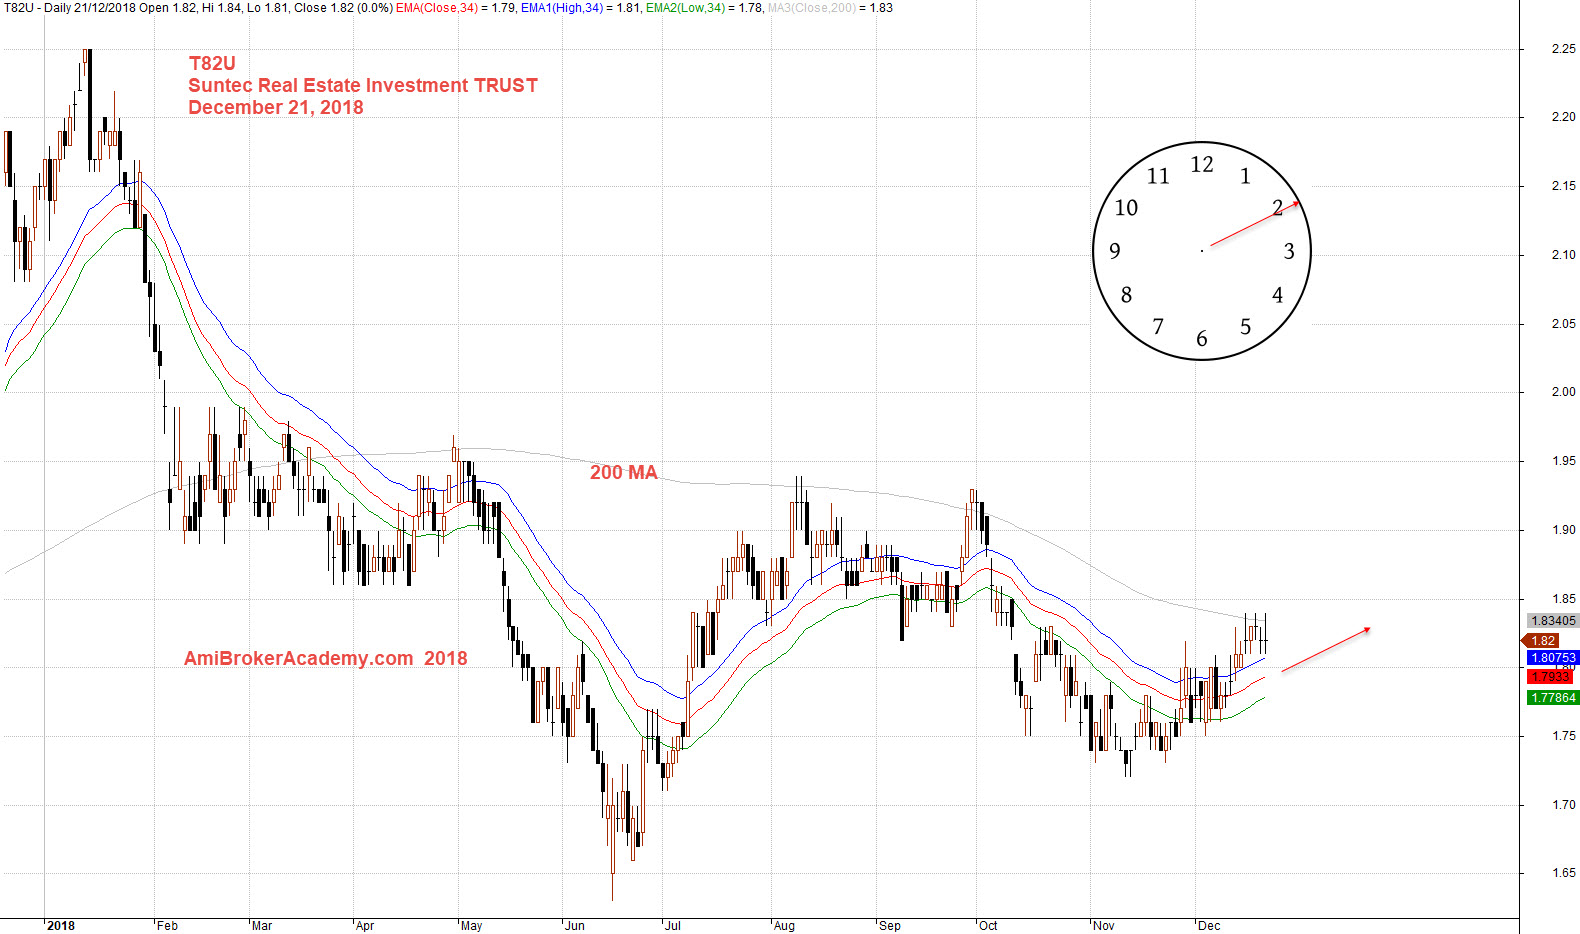
T82U Suntec Real Estate Investment TRUST Charting
When you study T82U, Suntec REIT stock price chart. Say what you like on property recovery, the market emotion just do not feel good. The stock price is weak, the cash is flowing out for sure. Why? See chart, the price action is lower.
The stock price was at 2.25 dollars at the start of the year, and the price action test the low below 1.65 dollars. It is quest similar to H M Gartley 222 pattern. The price action is rebounce.
Trade with your eyes open.
if you can see the full chart, “press Ctrl and -” to zoom out and see the entire chart.
Moses US Stock Chart Analysis
AmiBrokerAcademy.com
Disclaimer
The above result is for illustration purpose. It is not meant to be used for buy or sell decision. We do not recommend any particular stocks. If particular stocks of such are mentioned, they are meant as demonstration of Amibroker as a powerful charting software and MACD. Amibroker can program to scan the stocks for buy and sell signals.
These are script generated signals. Not all scan results are shown here. The MACD signal should use with price action. Users must understand what MACD and price action are all about before using them. If necessary you should attend a course to learn more on Technical Analysis (TA) and Moving Average Convergence Divergence, MACD.
Once again, the website does not guarantee any results or investment return based on the information and instruction you have read here. It should be used as learning aids only and if you decide to trade real money, all trading decision should be your own.