January 29, 2017
Welcome to Moses’s Singapore Stock Analysis @ AmiBrokerAcademy.com.
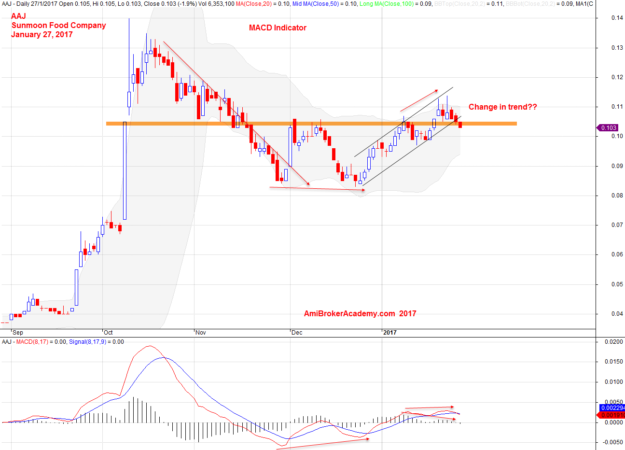
Sunmoon Food Company Daily and MACD Indicator
Picture worth a thousand words, if you can not figure out what is the trend give it a pass. Unless you die die must trade this stock.
In a simple sense, the stock close up a key level, but pullback and supported by the level.
How to define a key level?
This is a secret. Haha, this can be quite personal. Every trader may draw different support and resistance. Base on the trader experience you may appreciate the support and resistance differently.
So, if you must trade this stock. Wait! For the direction become clearer. For bearish, wait the breakout (lower) to complete. You will reduce risk, to wait for the retrace back to the level, only sell when price action get resisted by the level.
It will be the same for buy, wait for the price get supported by the level. Reduce the risk, you can wait for the price action to retest the key level, support again.
January 28, 2017 Sunmood Food Comapny and MACD Indicator
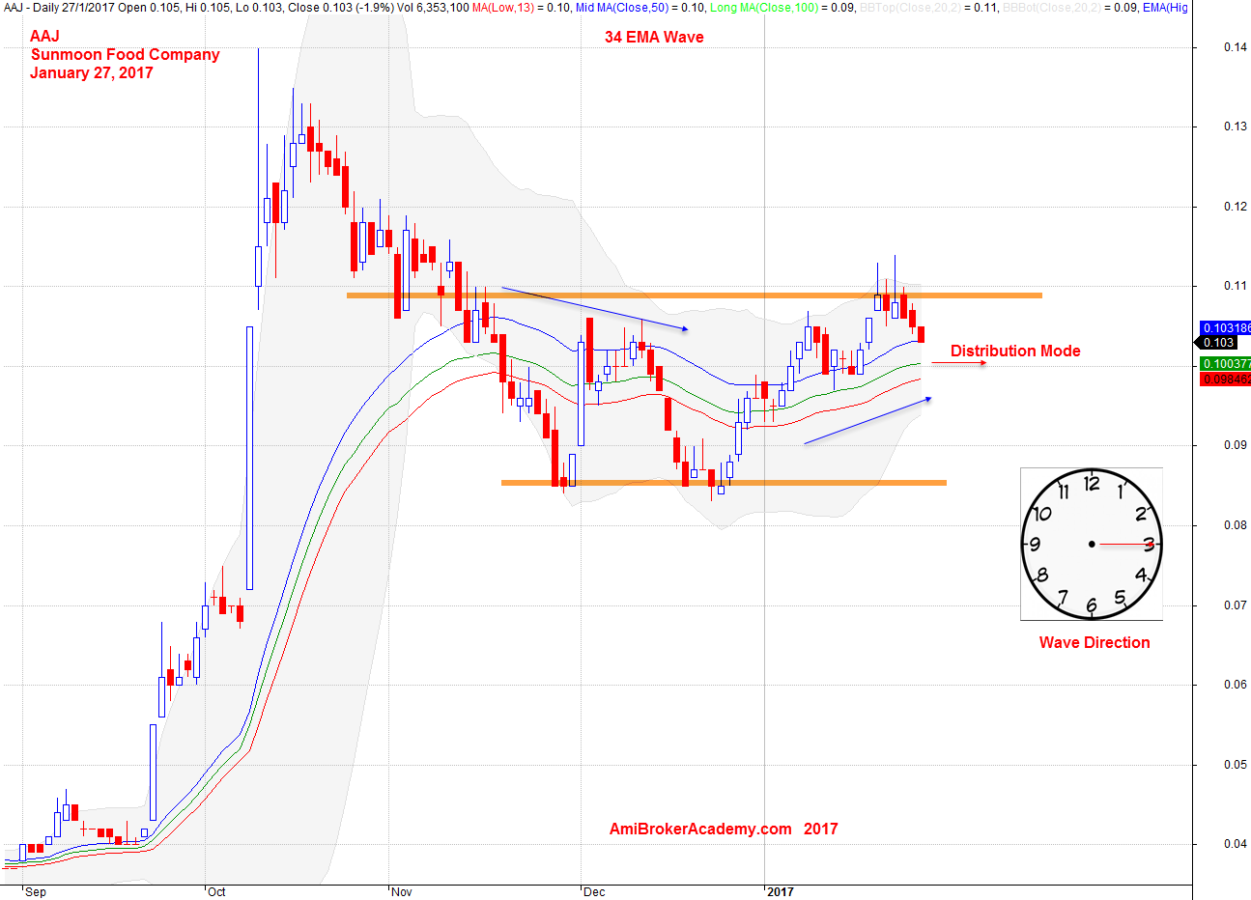
AAJ Sunmood Food and 34 EMA Wave
Let’s look at the chart using a different approach, add the moving average, a special moving average Wave. Let add a 34 EMA for High, Low and Close.
You can call it a band, we call it wave, 34 EMA Wave.
Price action has closed below the wave and get resisted by the wave. Finally, the wave close back above the 34 EMA Wave, and the price action start to float above the wave.
However, the wave direction is pointing at 3 o’clock. The price action is likely to be ranging, base on the 34 EMA wave trading strategy.
January 27, 2017 Sunmood Food Company and 34 EMA Wave
Moses
AmiBrokerAcademy.com
Disclaimer
The above result is for illustration purpose. It is not meant to be used for buy or sell decision. We do not recommend any particular stocks. If particular stocks of such are mentioned, they are meant as demonstration of Amibroker as a powerful charting software and MACD. Amibroker can program to scan the stocks for buy and sell signals.
These are script generated signals. Not all scan results are shown here. The MACD signal should use with price action. Users must understand what MACD and price action are all about before using them. If necessary you should attend a course to learn more on Technical Analysis (TA) and Moving Average Convergence Divergence, MACD.
Once again, the website does not guarantee any results or investment return based on the information and instruction you have read here. It should be used as learning aids only and if you decide to trade real money, all trading decision should be your own.