November 21, 2018
Thanks for visiting the site.
There is a reason for everything. Perhaps at the moment you do not have the answer.
Moses Stock Analysis
STI Straits Times Index Charting
Buy low sell high, buy support sell resistance.
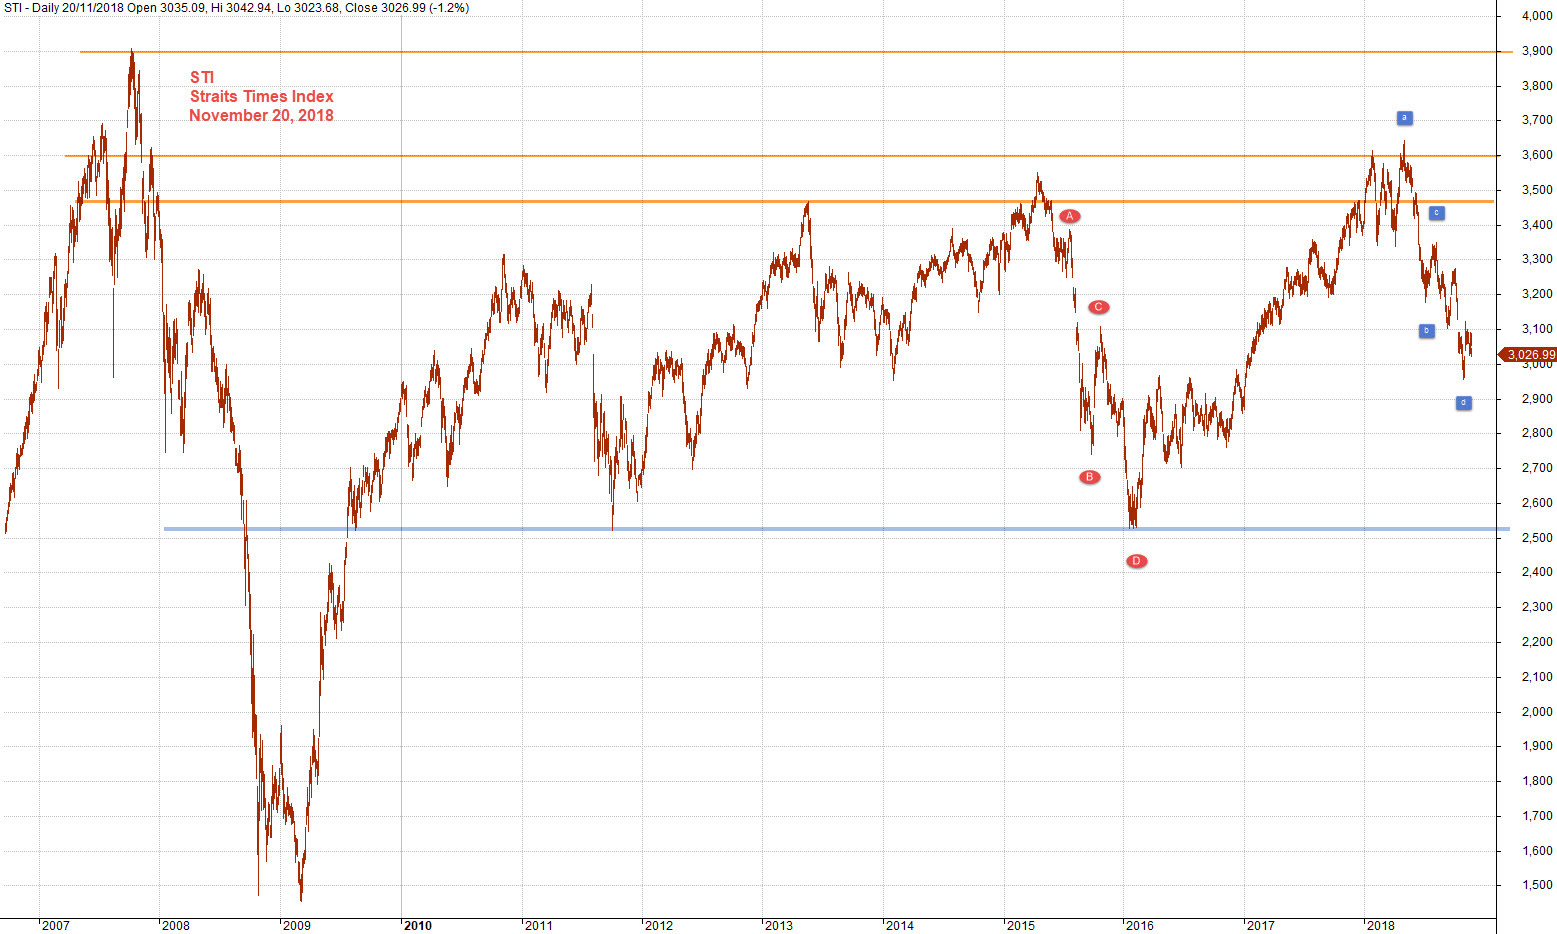
See chart, the price action of Straits Times Index stock chart.
Apply buy low sell high and buy hold strategy, BHS. The price action moves and test the high in 2007 at 3900 level, this is the highest so far from then till now. The price action after the peak at 3900 points and begin to crash down, this is the the start of the Great Recession. The price action continue to fall to low below 1500 points. The price action retest the 1500 points again before bounce up. The price action close above 3000 points, then 3300 points. The price action drop down and test near 2500 points. The price action retest 2500 points again. You could spot the price action has a near perfect H M Gartley 222 pattern. The price action rebounce from there to the high of 3600 and retest again before another near perfect abcd pattern.
If you see the chart, you will agree the price action actually move sideways between 2500 level and 3500 level.
Trade with eyes open, manage your risk.
November 20, 2018 Straits Times Index and levels and H M Gartley 222
Change the chart to line, you will see another perspective. See chart, picture worth a thousand words.
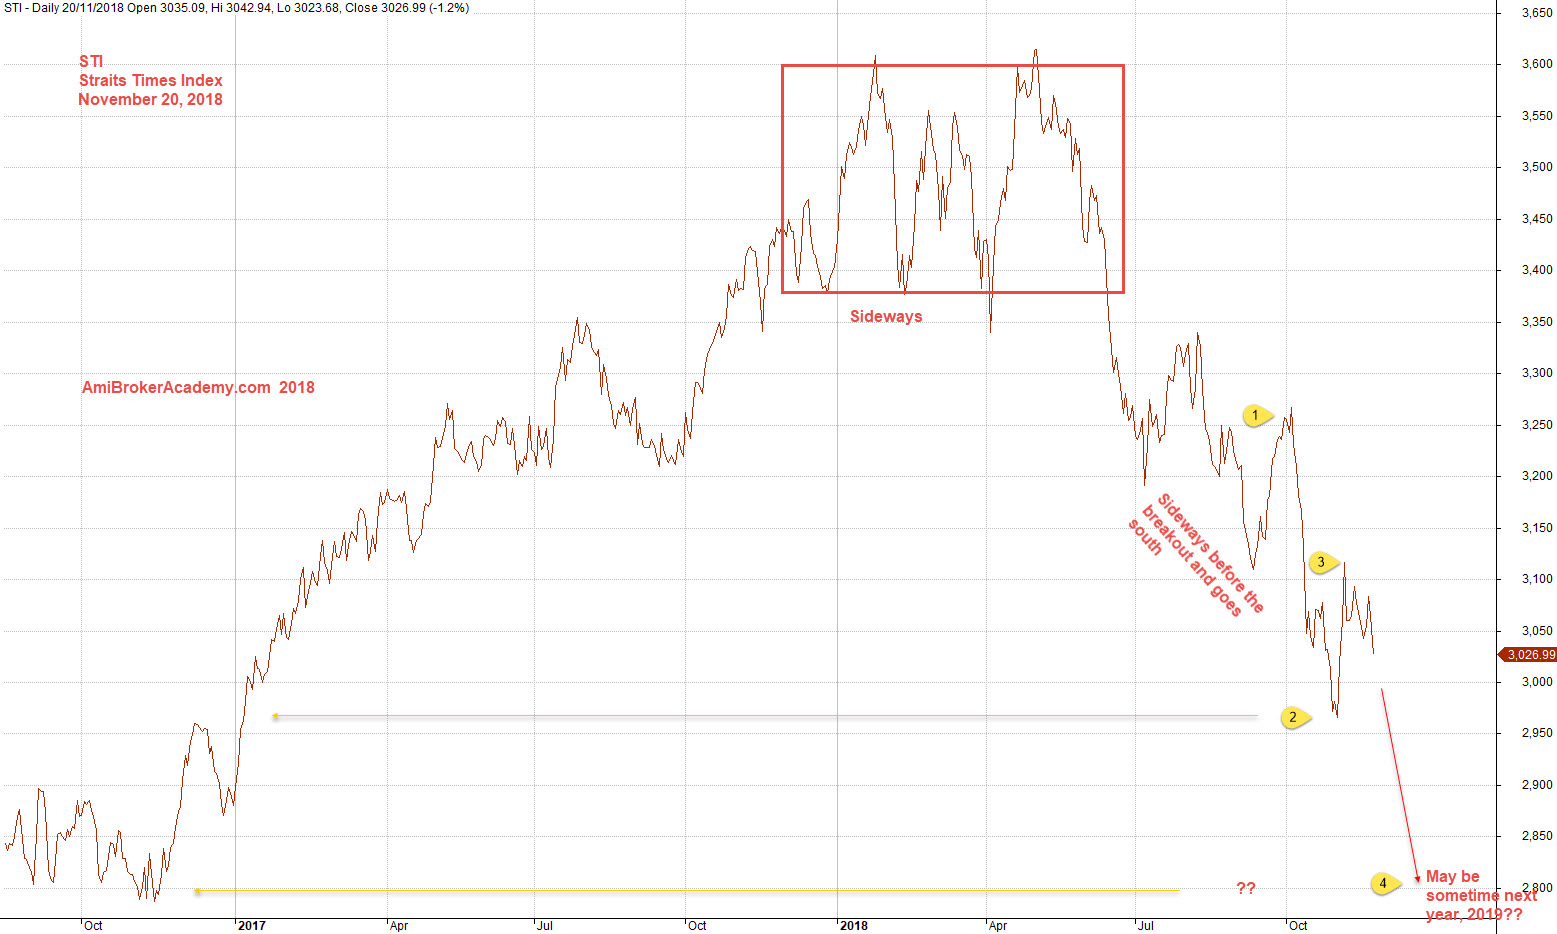
November 20, 2018 Straits Times Index and Sideways and H M Gartley
Add a MACD indicator, see chart. As said, don’t play play MACD does provide a clue on the price action trend. Trade with eyes open.
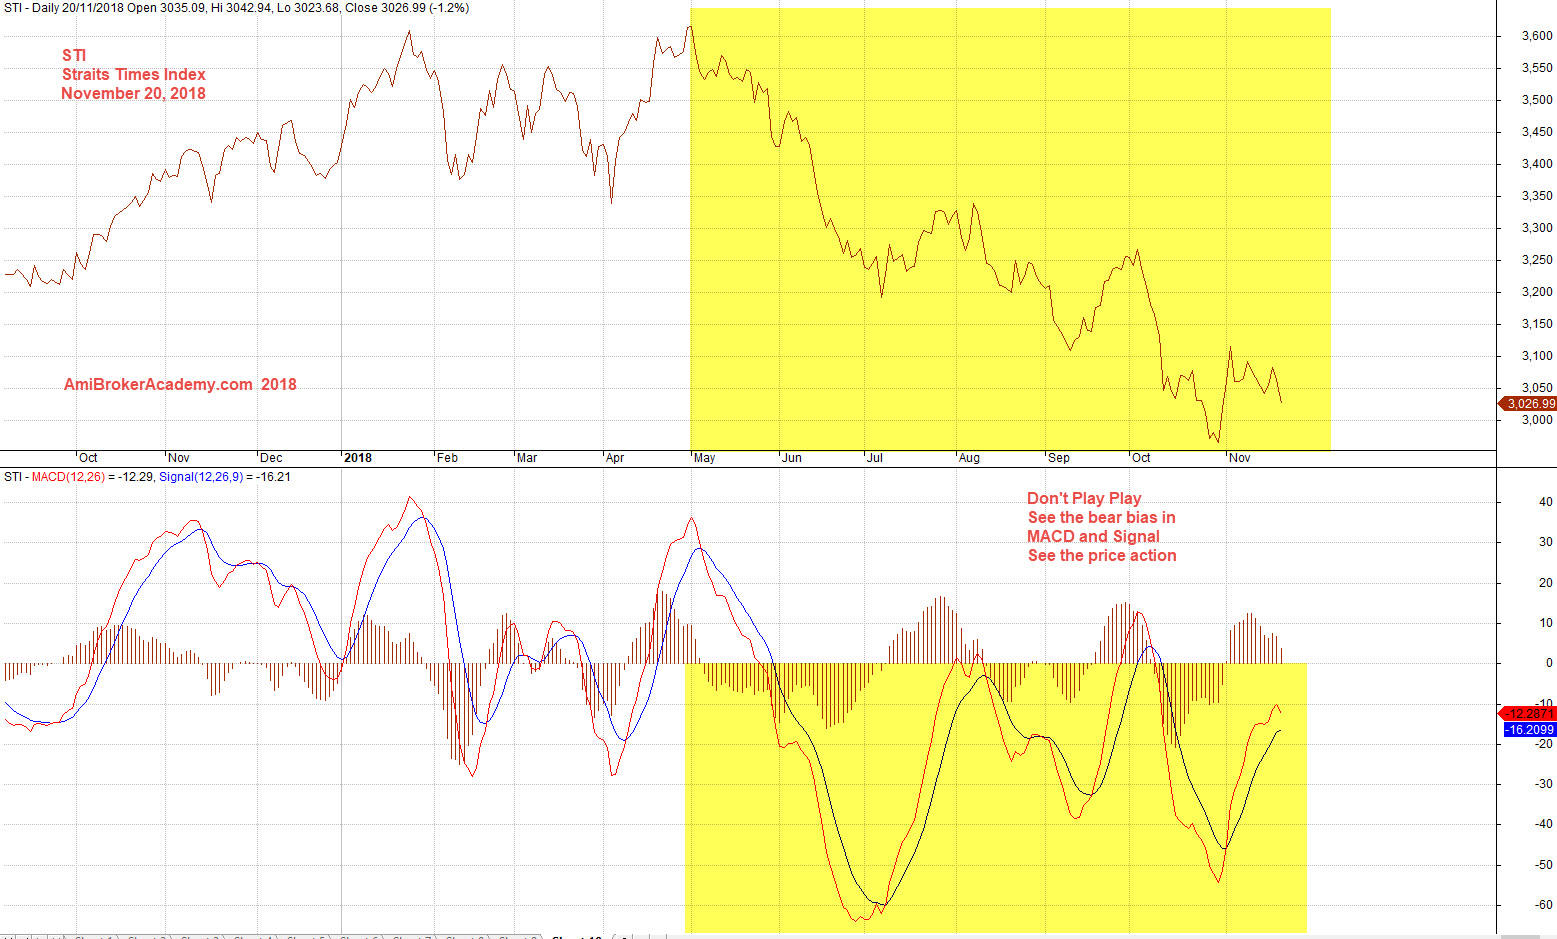
November 20, 2018 Straits Times Index and MACD
Moses
AmiBrokerAcademy.com
Disclaimer
The above result is for illustration purpose. It is not meant to be used for buy or sell decision. We do not recommend any particular stocks. If particular stocks of such are mentioned, they are meant as demonstration of Amibroker as a powerful charting software and MACD. Amibroker can program to scan the stocks for buy and sell signals.
These are script generated signals. Not all scan results are shown here. The MACD signal should use with price action. Users must understand what MACD and price action are all about before using them. If necessary you should attend a course to learn more on Technical Analysis (TA) and Moving Average Convergence Divergence, MACD.
Once again, the website does not guarantee any results or investment return based on the information and instruction you have read here. It should be used as learning aids only and if you decide to trade real money, all trading decision should be your own.