1 August, 2018
Singapore Stock Stories
C6L Singapore Airlines Charting
See chart, picture worth a thousand words. Study Singapore Airlines, SIA stock price back to day one. See stock chart. The price action had reached the peak above 16 dollars. But that is the highest ever from the stock IPO until today. See the boxes, the stock price has moved sideways a few times.
Now the stock price is approaching 9 dollars.
What will the the price action like for the next few days or weeks or maybe months? Will the stock price move lower? Monitor the stock price.
If the stock price after retest the low, and breakout. Breakout below, the stock price will continue to move lower. Remember, all setup can fail.
Manage your risk.
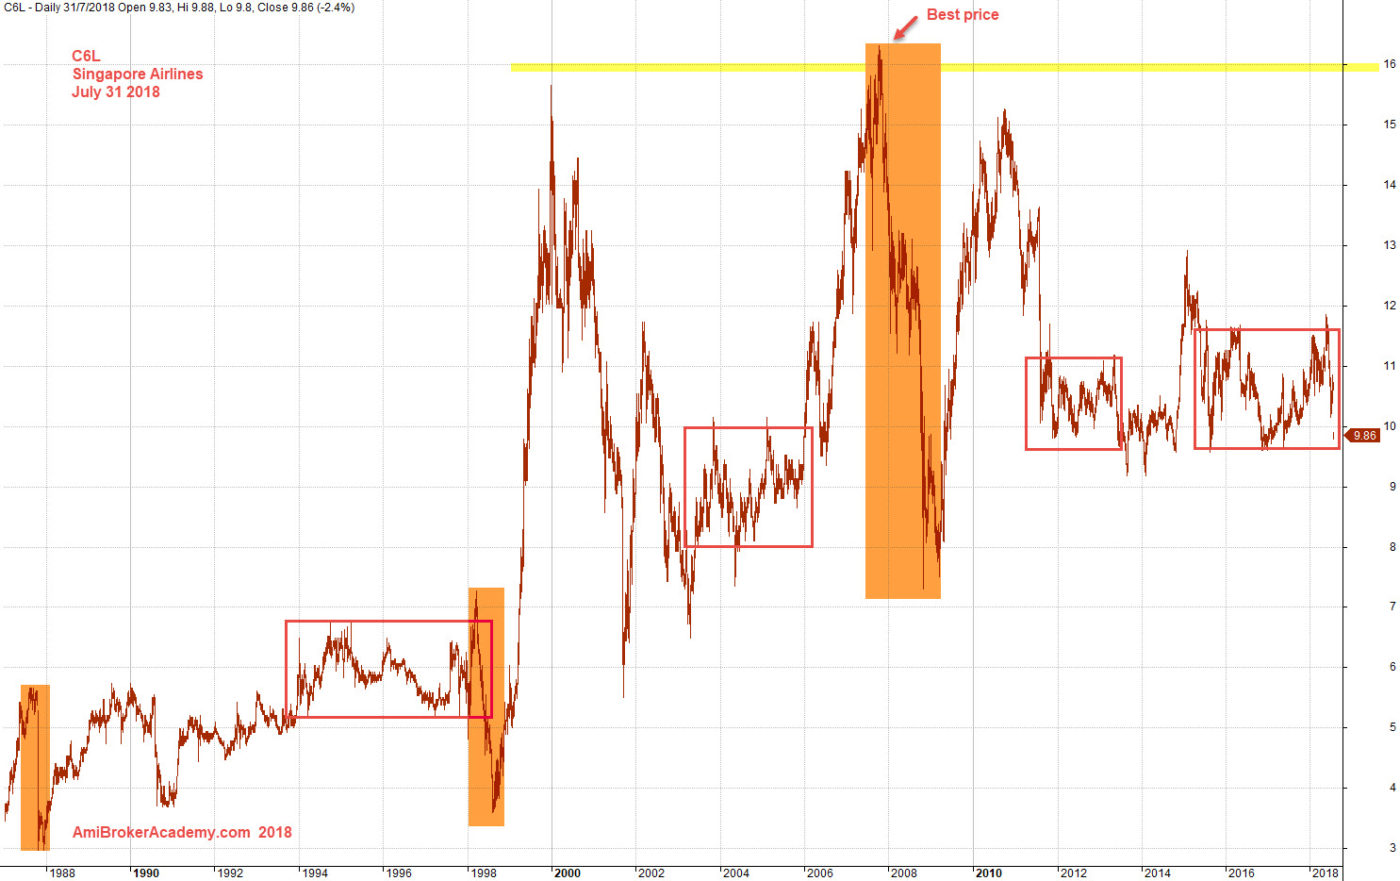
July 31, 2018 Singapore Airlines from Day-one
Manage your trade and risk.
Moses
AmiBrokerAcademy.com
Disclaimer
The above result is for illustration purpose. It is not meant to be used for buy or sell decision. We do not recommend any particular stocks. If particular stocks of such are mentioned, they are meant as demonstration of Amibroker as a powerful charting software and MACD. Amibroker can program to scan the stocks for buy and sell signals.
These are script generated signals. Not all scan results are shown here. The MACD signal should use with price action. Users must understand what MACD and price action are all about before using them. If necessary you should attend a course to learn more on Technical Analysis (TA) and Moving Average Convergence Divergence, MACD.
Once again, the website does not guarantee any results or investment return based on the information and instruction you have read here. It should be used as learning aids only and if you decide to trade real money, all trading decision should be your own.