May 17, 2017
The last time we study S63 was this year January. Please check back if you are interested what was our thinking.
S63 Singapore Tech Engineering and MACD
Study S63 Singapore Tech Engineering stock chart. Picture worth a thousand words. Manage your risk.
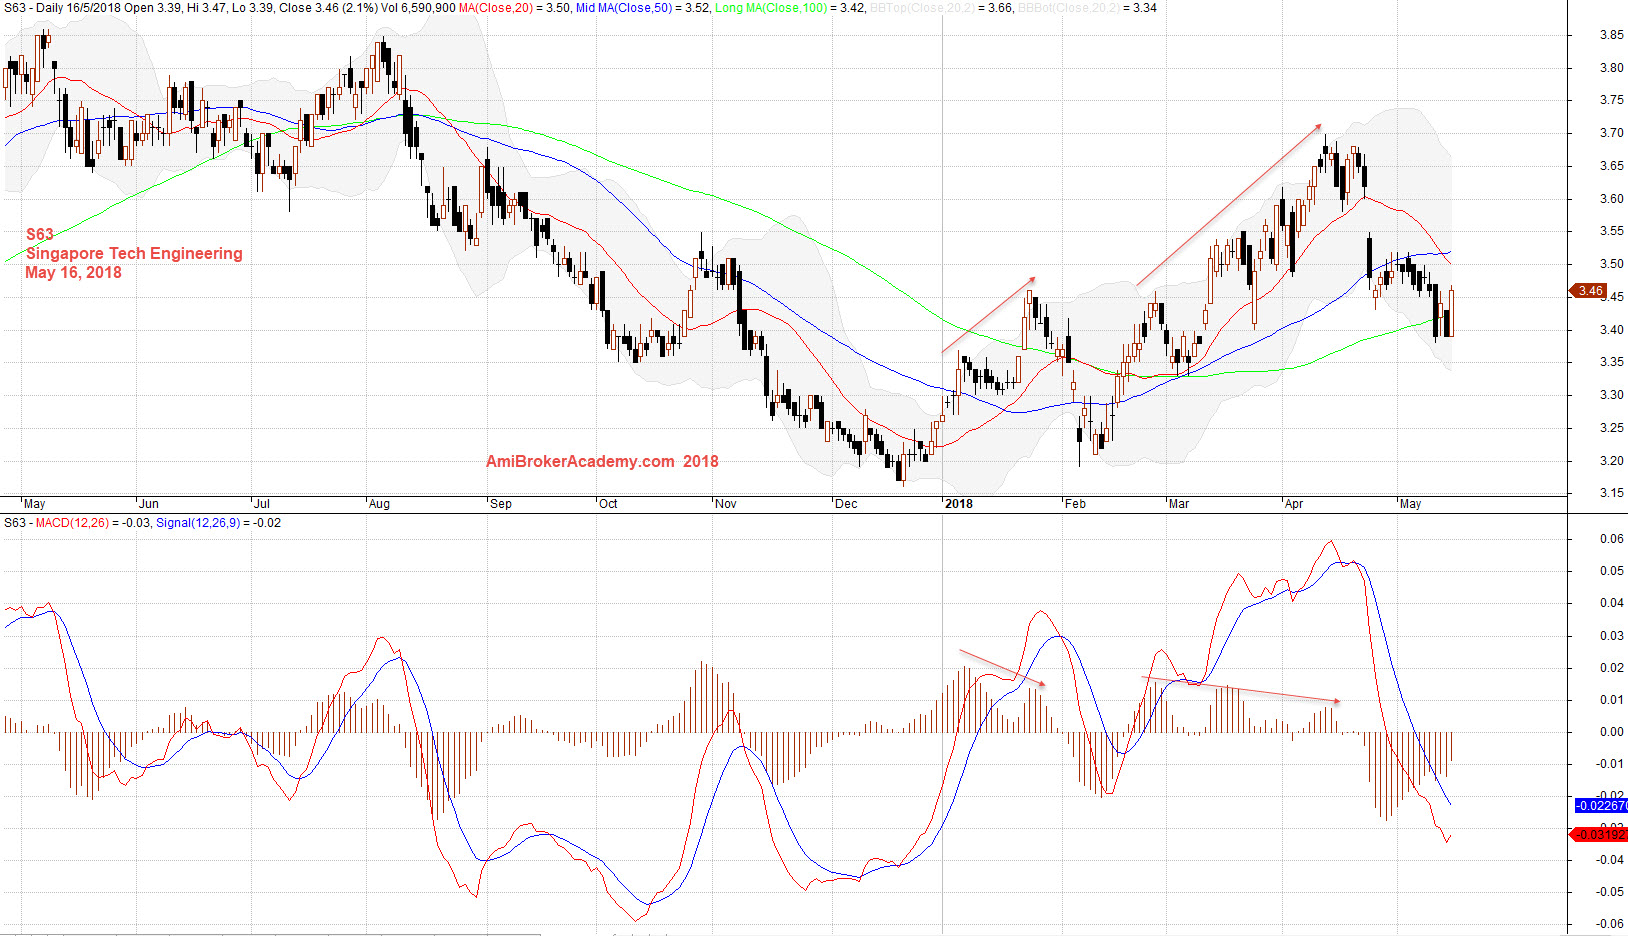
May 16, 2018 Singapore Tech Engineering and MACD
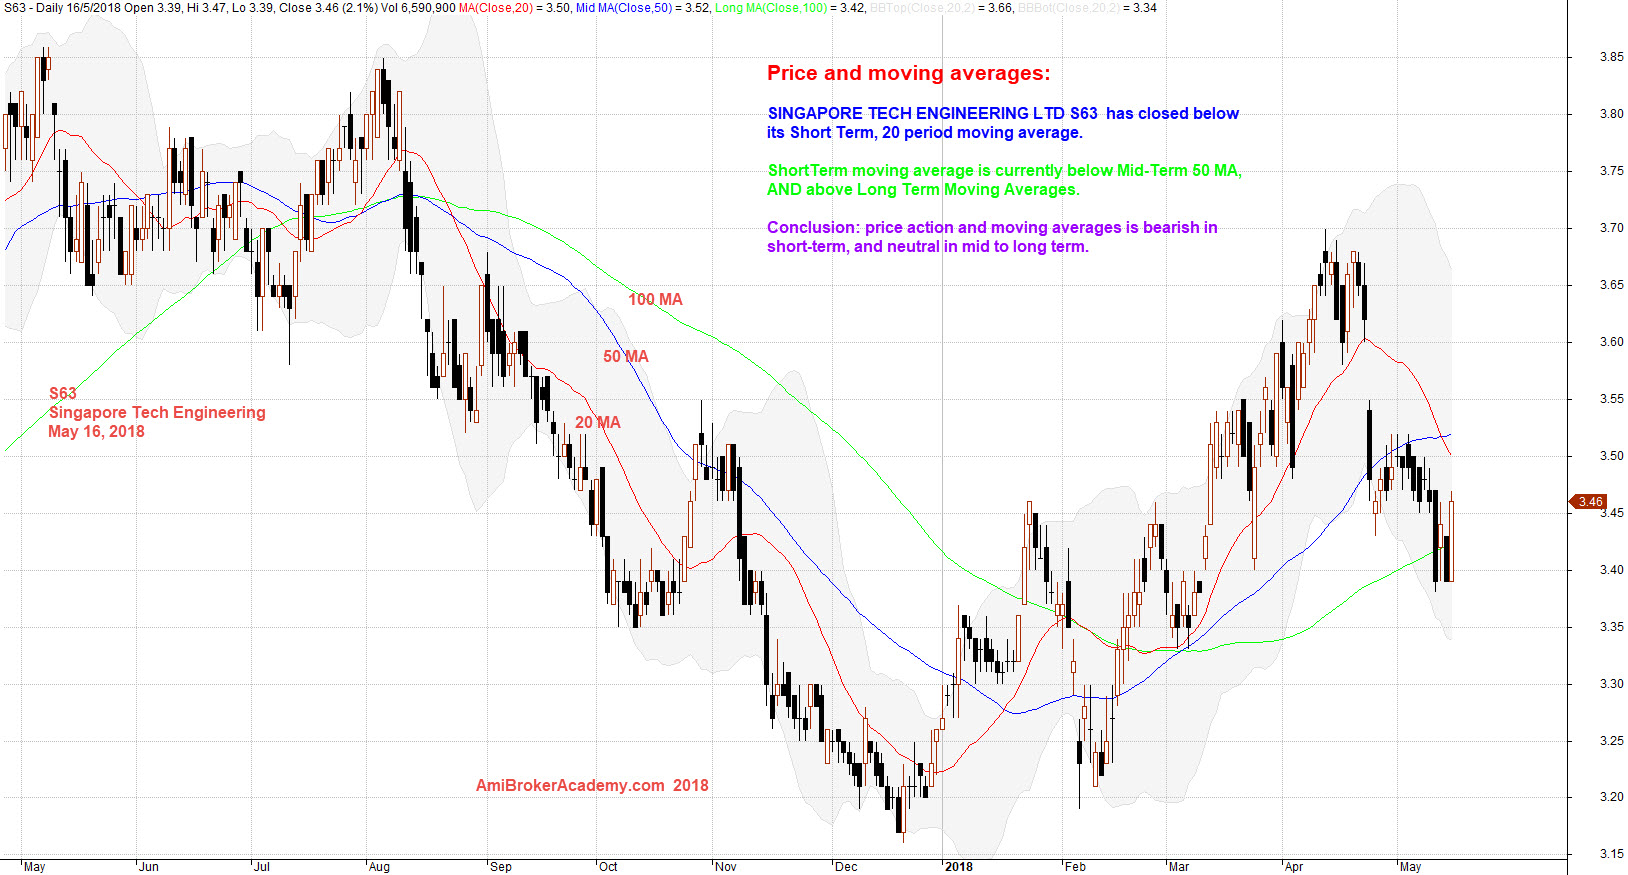
S63 Singapore Tech Engineering and Moving Averages
Study S63 Singapore Tech Engineering Price Action and Moving Averages. Picture worth a thousand words, see chart for details.
Price Action and Moving Average
SINGAPORE TECH ENGINEERING LTD S63 stock price has closed below its Short Term, 20 period moving average.
ShortTerm moving average is currently below Mid-Term 50 MA, AND above Long Term Moving Averages.
Conclusion: price action and moving averages is bearish in short-term, and neutral in mid to long term.
Manage Your Risk
But remember all setup can fail, manage your risk.
May 16, 2018 Singapore Tech Engineering and MAs
Moses
AmiBrokerAcademy.com
Disclaimer
The above result is for illustration purpose. It is not meant to be used for buy or sell decision. We do not recommend any particular stocks. If particular stocks of such are mentioned, they are meant as demonstration of Amibroker as a powerful charting software and MACD. Amibroker can program to scan the stocks for buy and sell signals.
These are script generated signals. Not all scan results are shown here. The MACD signal should use with price action. Users must understand what MACD and price action are all about before using them. If necessary you should attend a course to learn more on Technical Analysis (TA) and Moving Average Convergence Divergence, MACD.
Once again, the website does not guarantee any results or investment return based on the information and instruction you have read here. It should be used as learning aids only and if you decide to trade real money, all trading decision should be your own.