June 3, 2017
Singapore Stock Analysis
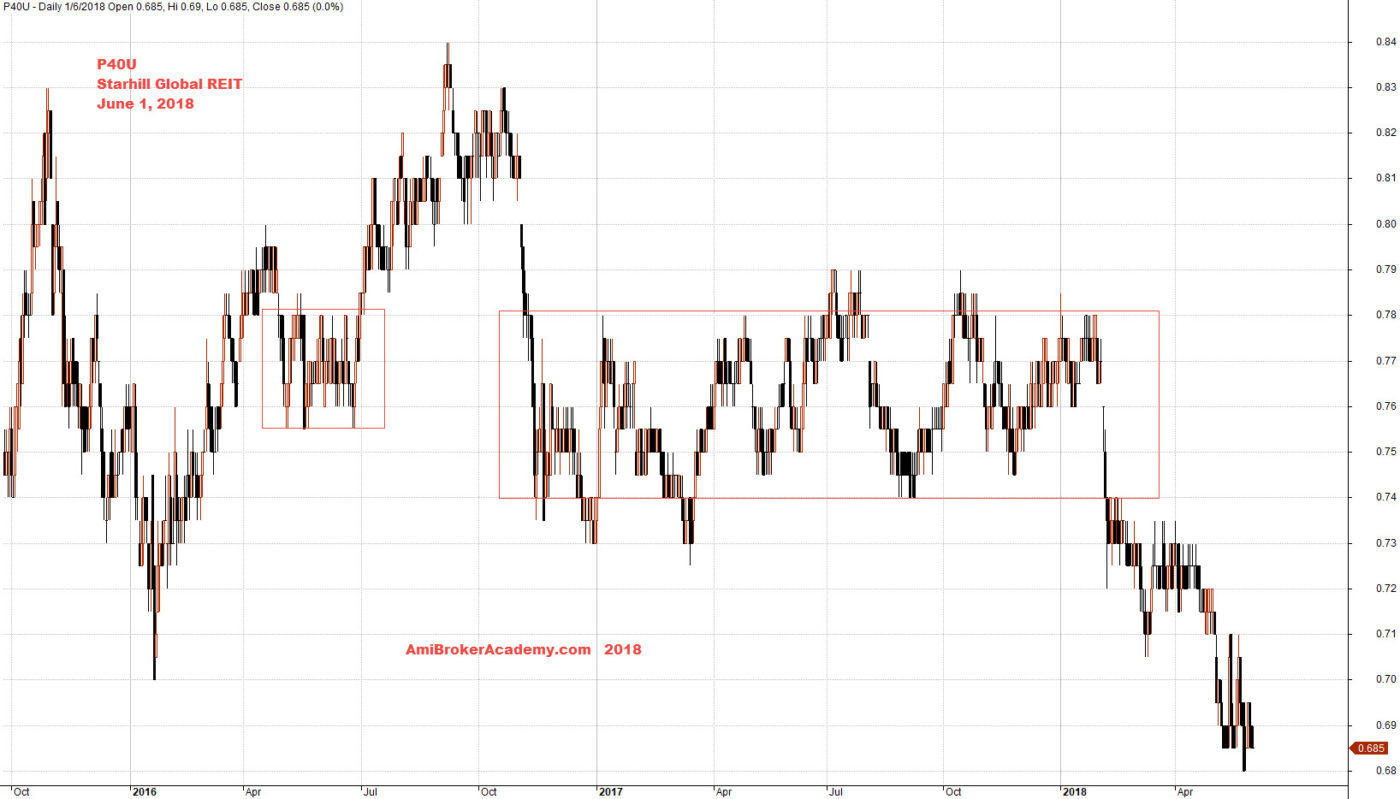
P40U Starhill Global REIT Stock Charting
See chart, picture worth a thousand words. Study Starhill Global REIT stock chart, we see the price action trapped inside the boxes, sideways. To make money when price is trapped within boxes is hard. Wait. Wait for the price action to breakout from the boxes. But for price action breakout, it can fail too. Manage your trade.
Manage your risk.
June 1, 2018 Starhill Global REIT and Sideways
Zoom Inc
P40U Starhill Global REIT Stock Charting
See chart, the price action move in downflow sideways, downflow again. … So, trade with eyes open.
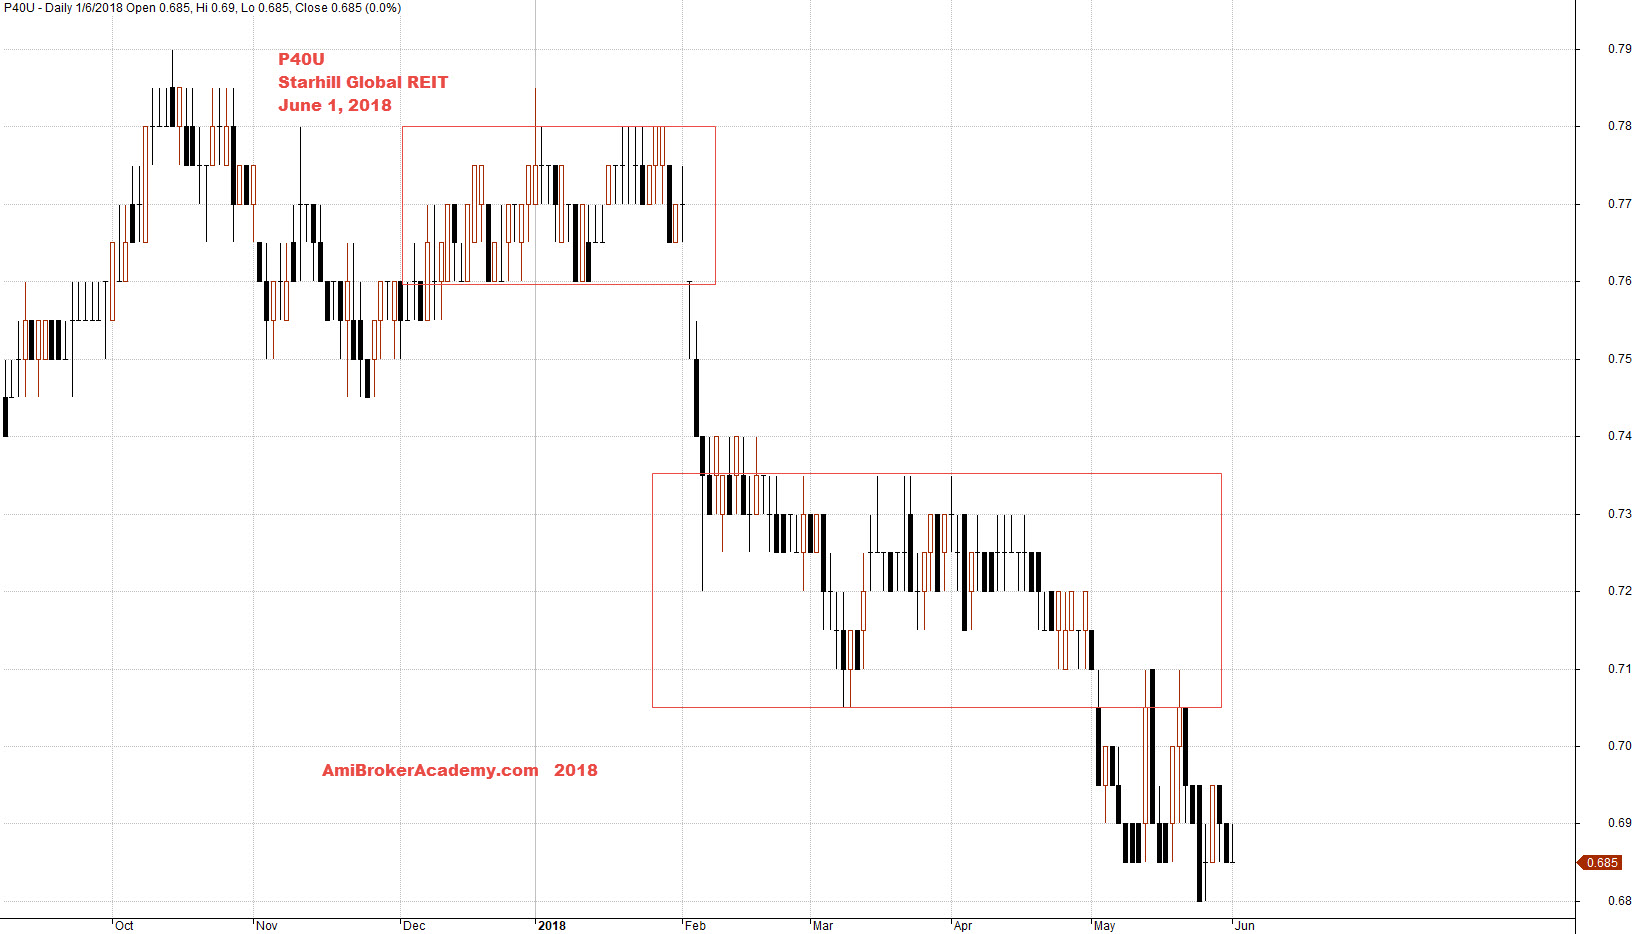
June 1, 2018 Starhill Global REIT and Zoom In Sideways
Moses
AmiBrokerAcademy.com
Disclaimer
The above result is for illustration purpose. It is not meant to be used for buy or sell decision. We do not recommend any particular stocks. If particular stocks of such are mentioned, they are meant as demonstration of Amibroker as a powerful charting software and MACD. Amibroker can program to scan the stocks for buy and sell signals.
These are script generated signals. Not all scan results are shown here. The MACD signal should use with price action. Users must understand what MACD and price action are all about before using them. If necessary you should attend a course to learn more on Technical Analysis (TA) and Moving Average Convergence Divergence, MACD.
Once again, the website does not guarantee any results or investment return based on the information and instruction you have read here. It should be used as learning aids only and if you decide to trade real money, all trading decision should be your own.