1 January, 2019
Happy 2019! Set up 2019 Trading Resolution now.
Life has its ups and downs, stock chart is also like life. Currently for the example below, the price action is an ‘down’.
But one day, the stock price will turns up. Trade with eyes open.
Think think got more things.
Thanks for visiting the site.
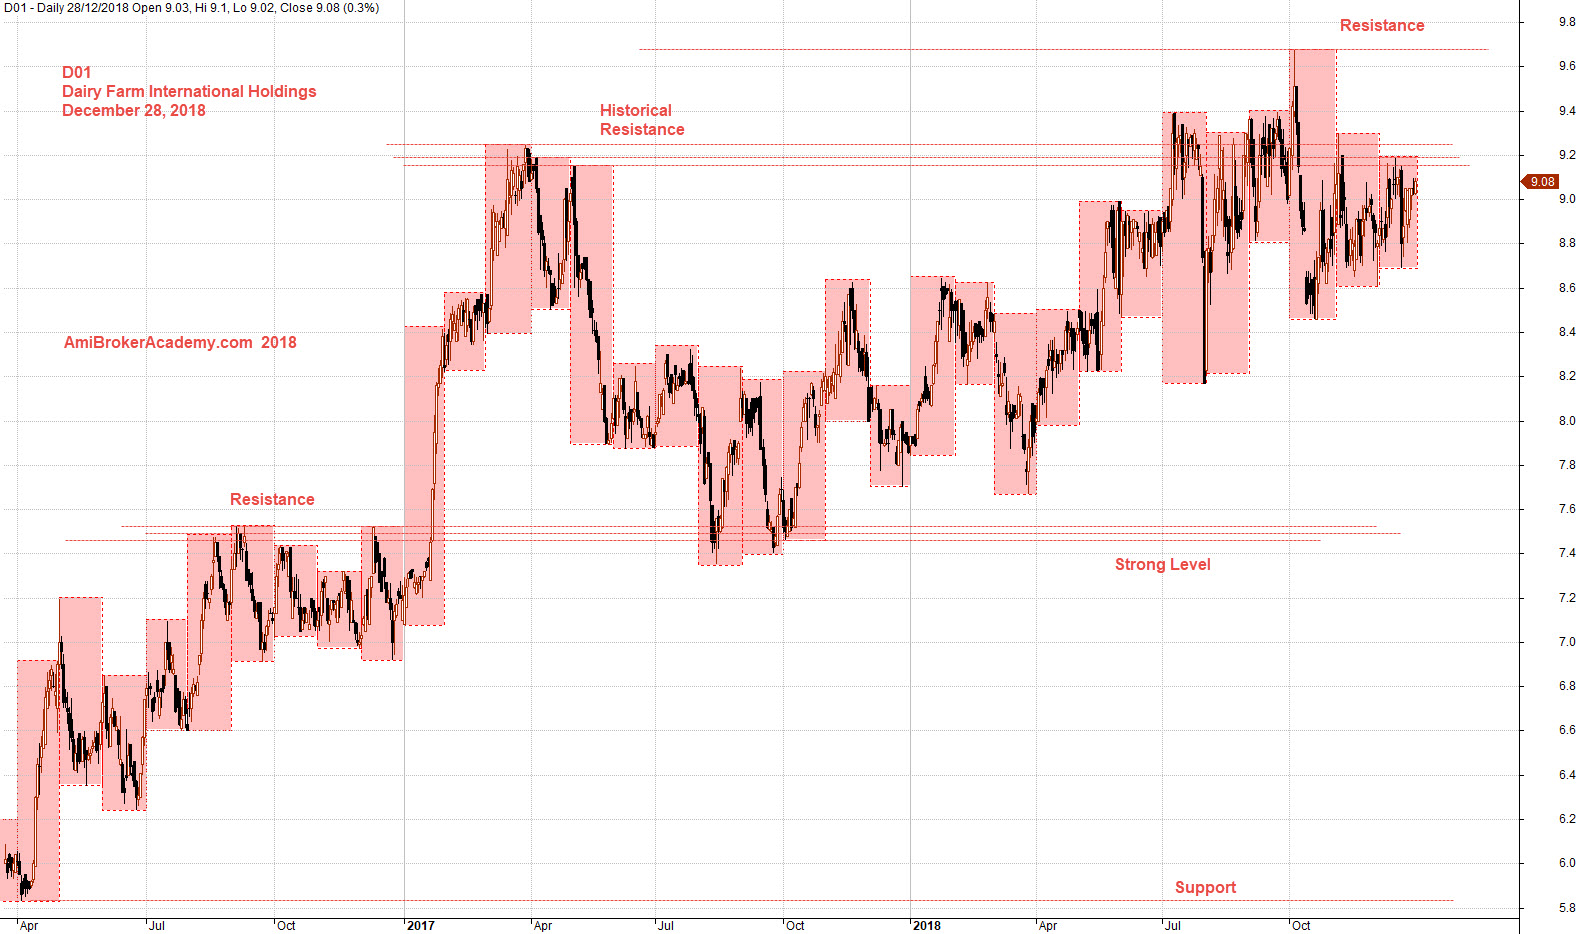
D01 Dairy Farm International Holdings Charting
Study Dairy Farm International Holdings stock chart using month high low to study the support resistance.
You could find the price action retest the high, the price reach the high at 9.6 dollars. From a different perspective, the price that cross above 9.2 dollars could be trapped.
As you could see the price close below 9.2 dollars. If the price action does not close above 9.2 dollars, you can be sure that those whom bought the stock price above 9.2 dollars will be ended up bull trapped.
Trade with your eyes open.
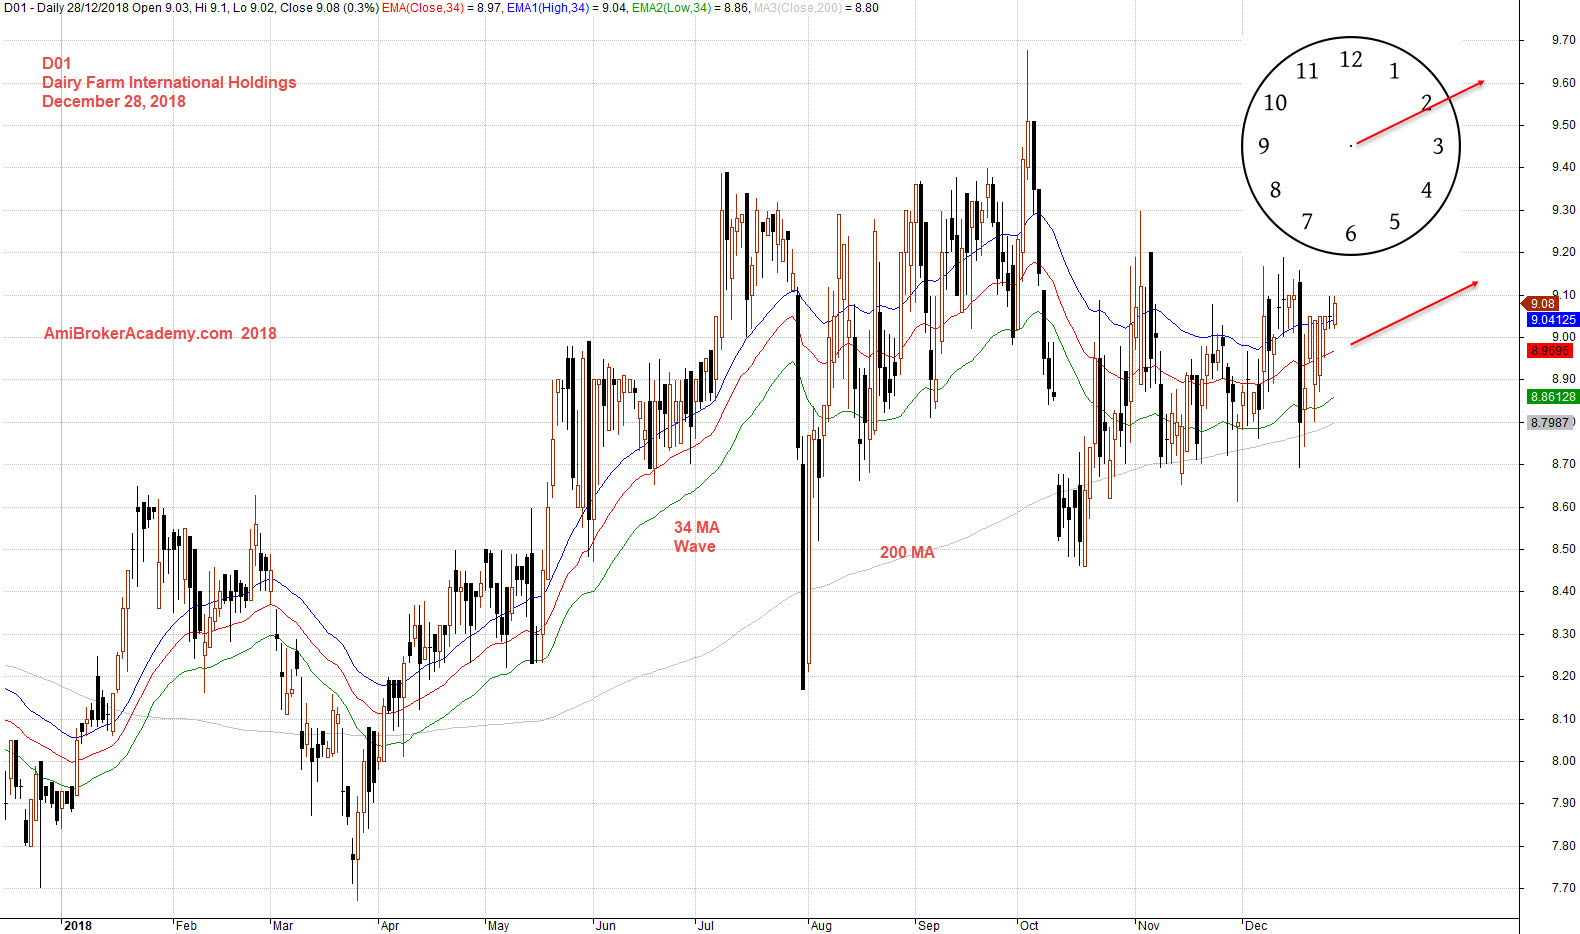
if you can see the full chart, “press Ctrl and -” to zoom out and see the entire chart.
Add moving average to the chart, you could easily see the price action is currently below 34 MA wave. The price action is struggled to cross above MA river.
Trade with eyes open.
Moses Stock Chart Analysis
AmiBrokerAcademy.com
Disclaimer
The above result is for illustration purpose. It is not meant to be used for buy or sell decision. We do not recommend any particular stocks. If particular stocks of such are mentioned, they are meant as demonstration of Amibroker as a powerful charting software and MACD. Amibroker can program to scan the stocks for buy and sell signals.
These are script generated signals. Not all scan results are shown here. The MACD signal should use with price action. Users must understand what MACD and price action are all about before using them. If necessary you should attend a course to learn more on Technical Analysis (TA) and Moving Average Convergence Divergence, MACD.
Once again, the website does not guarantee any results or investment return based on the information and instruction you have read here. It should be used as learning aids only and if you decide to trade real money, all trading decision should be your own.