December 30, 2018
Think think got more things.
Thanks for visiting the site.
Can US market become better next year? US market begin to weaken from October. With the next tariff policy, US has a short term gain, but the kick back shall be next year. This can be as long as to near the next election.
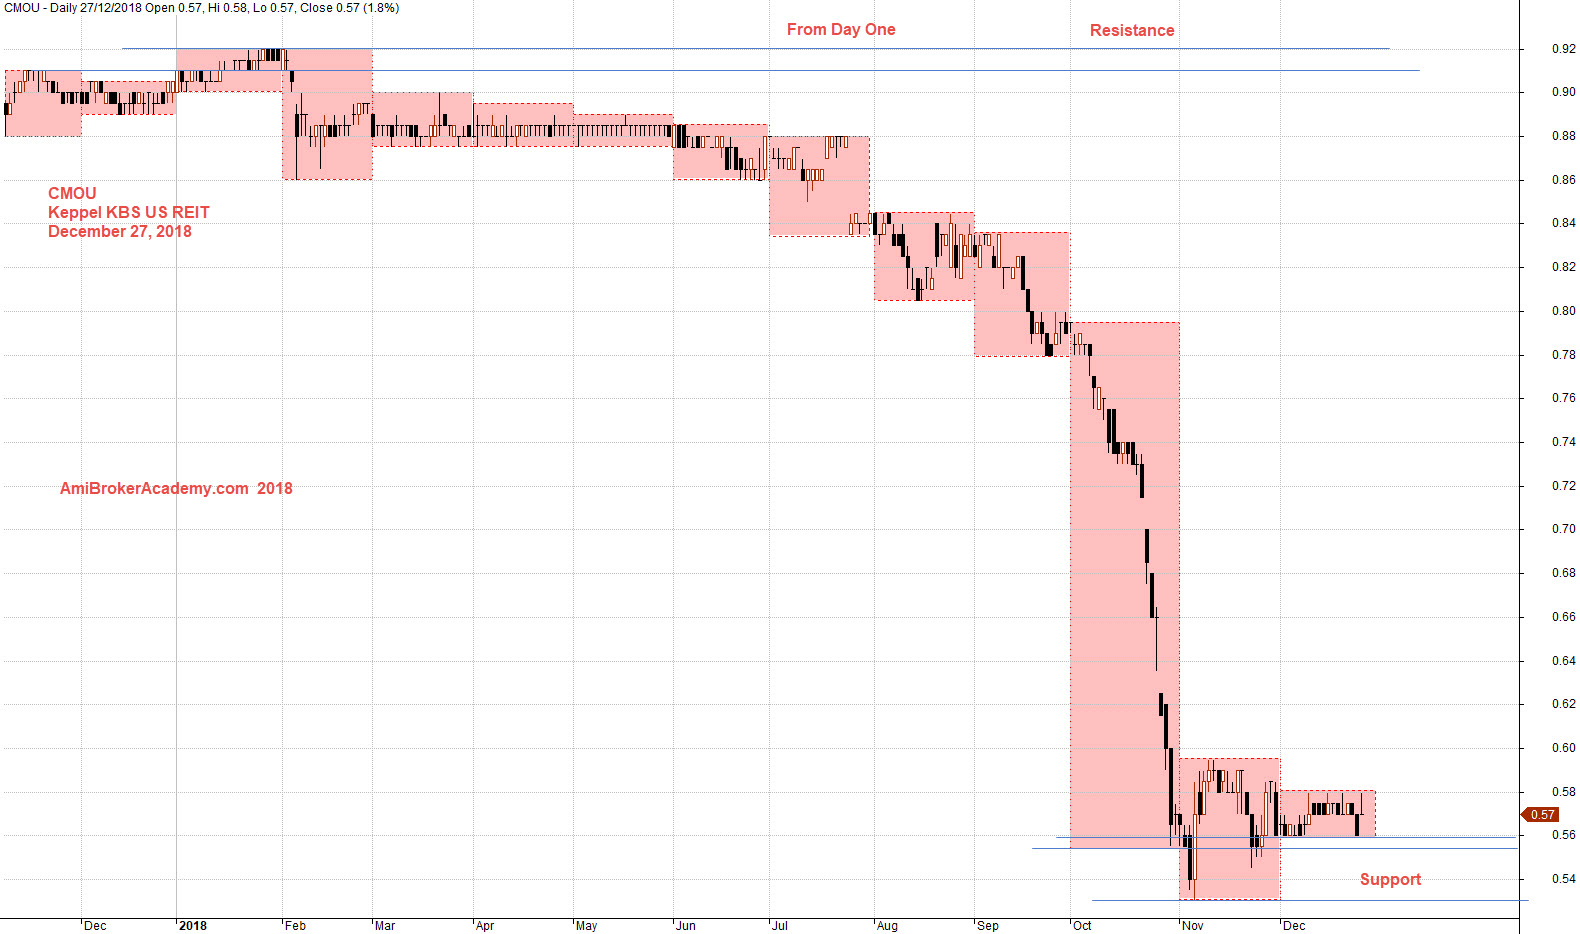
CMOU Keppel KBS US REIT Charting
Study Keppel KBS US REIT stock chart using the month high low or resistance support. From chat, we see the price action move from resistance to support. Now the price action is near support.
In the next year, 2019 trading plan you should look out for a buy opportunity as we believe in buy low and sell high.
Trade with your eyes open.
if you can see the full chart, “press Ctrl and -” to zoom out and see the entire chart.
Moses Stock Chart Analysis
AmiBrokerAcademy.com
Disclaimer
The above result is for illustration purpose. It is not meant to be used for buy or sell decision. We do not recommend any particular stocks. If particular stocks of such are mentioned, they are meant as demonstration of Amibroker as a powerful charting software and MACD. Amibroker can program to scan the stocks for buy and sell signals.
These are script generated signals. Not all scan results are shown here. The MACD signal should use with price action. Users must understand what MACD and price action are all about before using them. If necessary you should attend a course to learn more on Technical Analysis (TA) and Moving Average Convergence Divergence, MACD.
Once again, the website does not guarantee any results or investment return based on the information and instruction you have read here. It should be used as learning aids only and if you decide to trade real money, all trading decision should be your own.