March 2, 2018
15th Day CNY Spring Lantern Festival – YuanXiaoJie 元宵节
March 2, the 15th day of Chinese New Year, also known as The Lantern Festival or the Spring Lantern Festival. It marks the last day of the CNY celebrations. It is also known as Chinese Valentine’s Day.
Happy Yuan Xiao Jie! Happy (Chinese) Valentine Day! Huat Ah!

Spring Lantern Festival – 15th Day CNY (Source: What’s Apps Group)
Powerful Chart Software – AmiBroker
The following chart is produced using AmiBroker charting software. It is a powerful chart software. You plot the stocks you are interested all in one chart, as long as you still could read them. See chart below. Thereafter slowly climb up, step by step.
Singapore Stock Analysis
C2PU Parkwaylife REIT and Fibonacci Extension
Study chart for more, picture worth a thousand words, swing low to high draw Fibonacci Extension, the price action breakout 127% and almost touch 161.8% and again. But the price fail and decline very arrubtly the price breakout below the high, 0%. The pullback was strong, and the price action drop abruptly to test the 127%, but fail through the 127%. The price action struggle to jump up, now the price action is hanging there at 127%.
Can the price stay around 2.80? Will see.
Manage your risk!
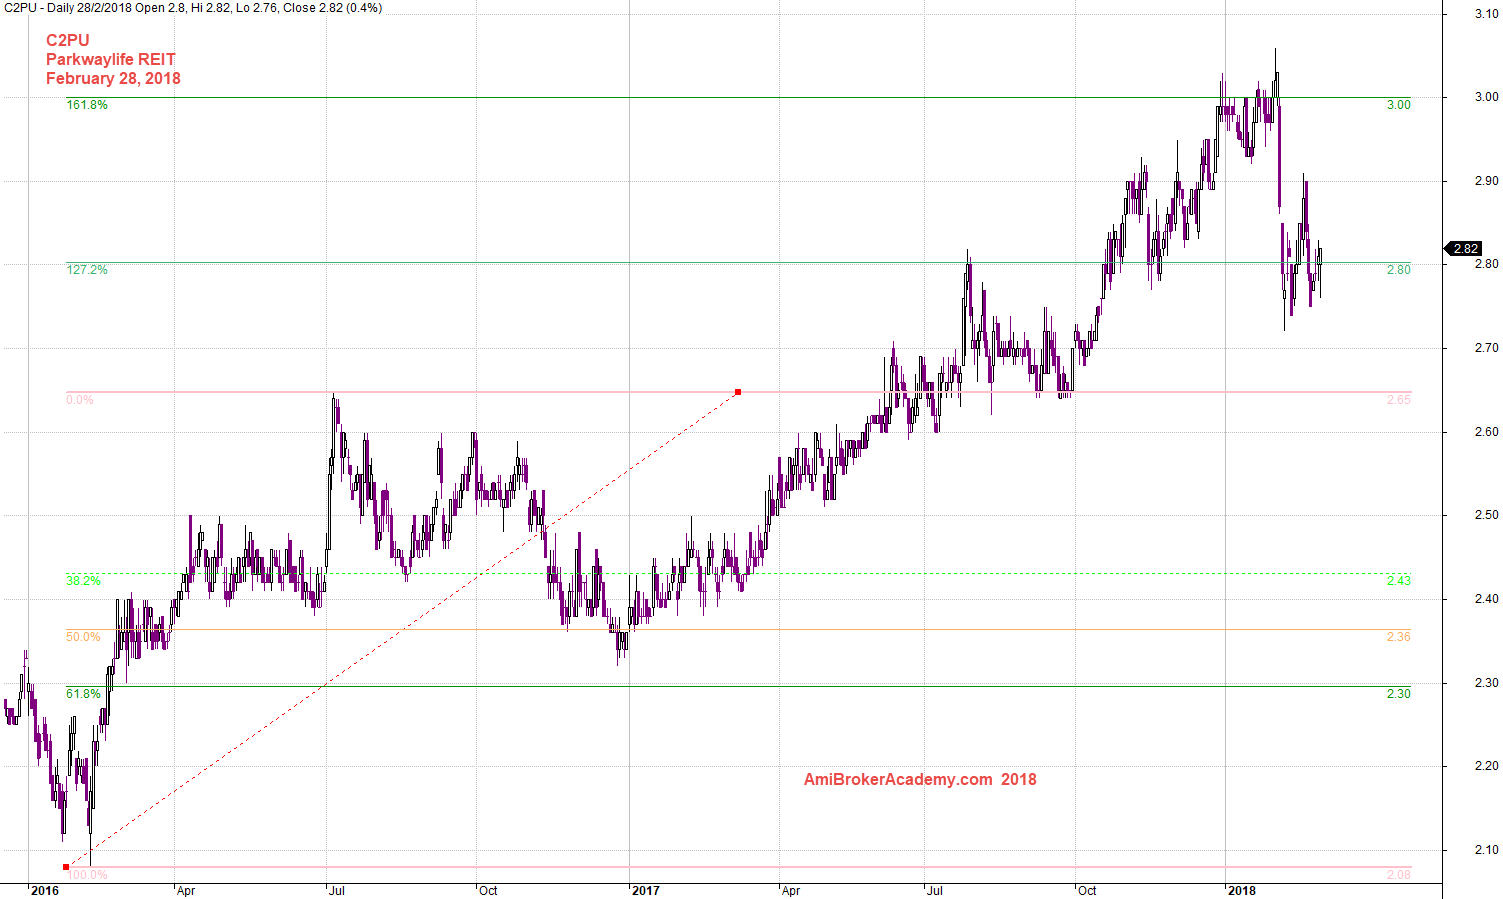
February 28, 2018 Parkwaylife REIT and Fibo Extension and Swing Low to High
C2PU Parkwaylife REIT and MA Band
See chart of the visual effect, what is the mind tell you? Sell right. We see the price cross and close below MA band. The price try to pullback, but get resisted by the MA Band. The tail of the MA band is now slopping down, bearish. Manage your risk.
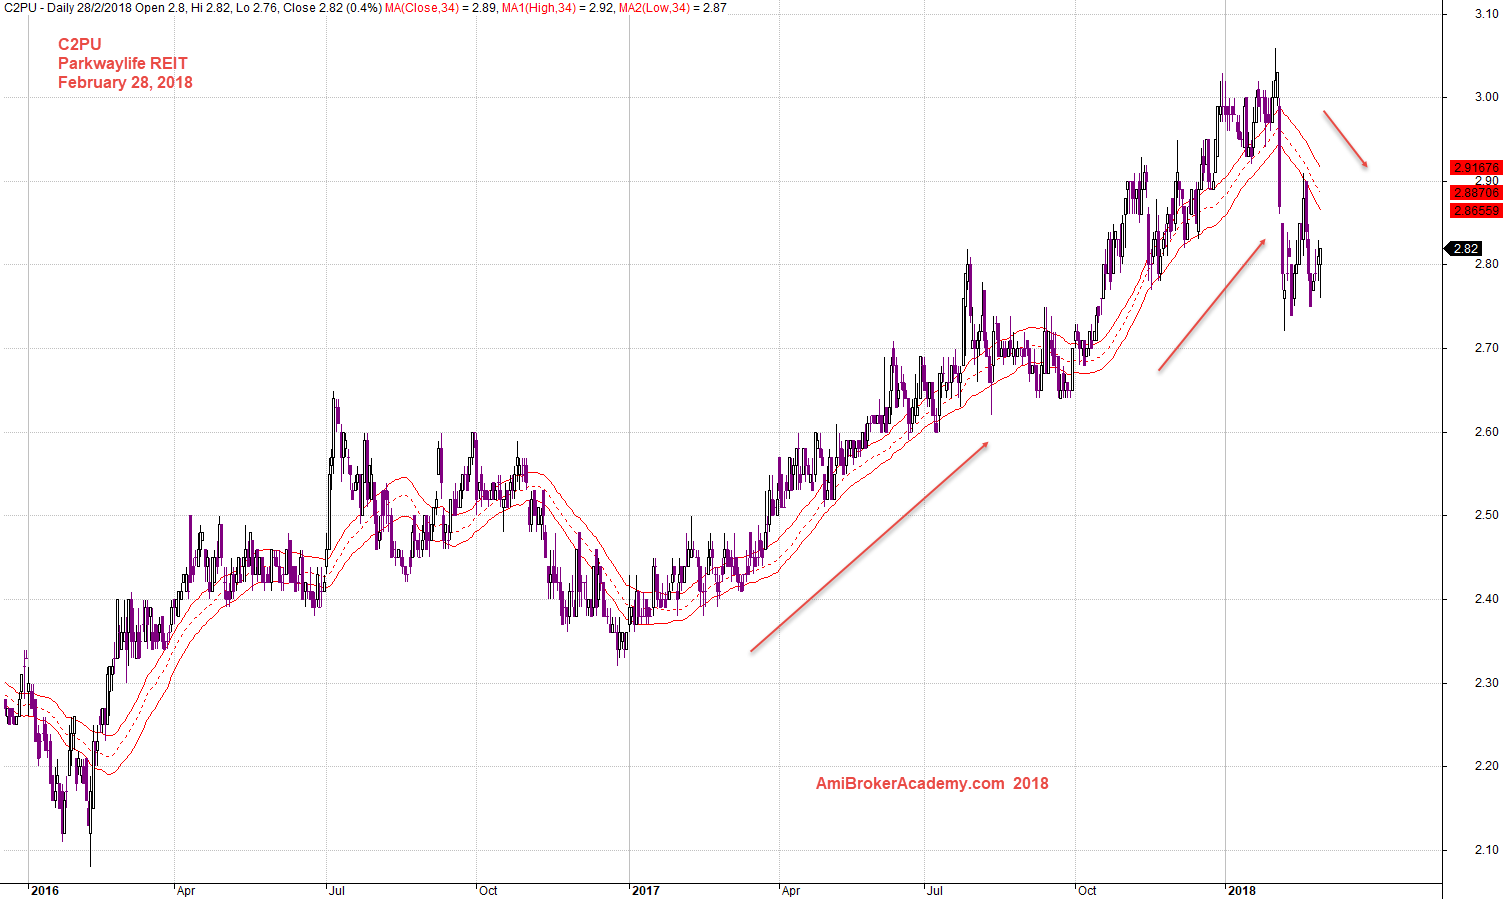
20180228 Parkwaylife REIT and MA Band
Moses Singapore Stock Analysis
AmiBrokerAcademy.com
Disclaimer
The above result is for illustration purpose. It is not meant to be used for buy or sell decision. We do not recommend any particular stocks. If particular stocks of such are mentioned, they are meant as demonstration of Amibroker as a powerful charting software and MACD. Amibroker can program to scan the stocks for buy and sell signals.
These are script generated signals. Not all scan results are shown here. The MACD signal should use with price action. Users must understand what MACD and price action are all about before using them. If necessary you should attend a course to learn more on Technical Analysis (TA) and Moving Average Convergence Divergence, MACD.
Once again, the website does not guarantee any results or investment return based on the information and instruction you have read here. It should be used as learning aids only and if you decide to trade real money, all trading decision should be your own.