March 2, 2018
YuanXiaoJie 元宵节
Happy Yuan Xiao Jie! Happy (Chinese) Valentine Day! Huat Ah!

15th Day CNY YuanXiaoJie 元宵节 (Source: What’s Apps Group)
Powerful Chart Software – AmiBroker
The following chart is produced using AmiBroker charting software. It is a powerful chart software. You plot the stocks you are interested all in one chart, as long as you still could read them. See chart below. Thereafter slowly climb up, step by step.
Singapore Stock Analysis
B61 Bukit Sembawang Estates and Fibonacci Retracement
Study chart for more, picture worth a thousand words, swing low to high draw Fibonacci Retracement, from September low to August high, the price retrace down to 38.2%.
Manage your risk!
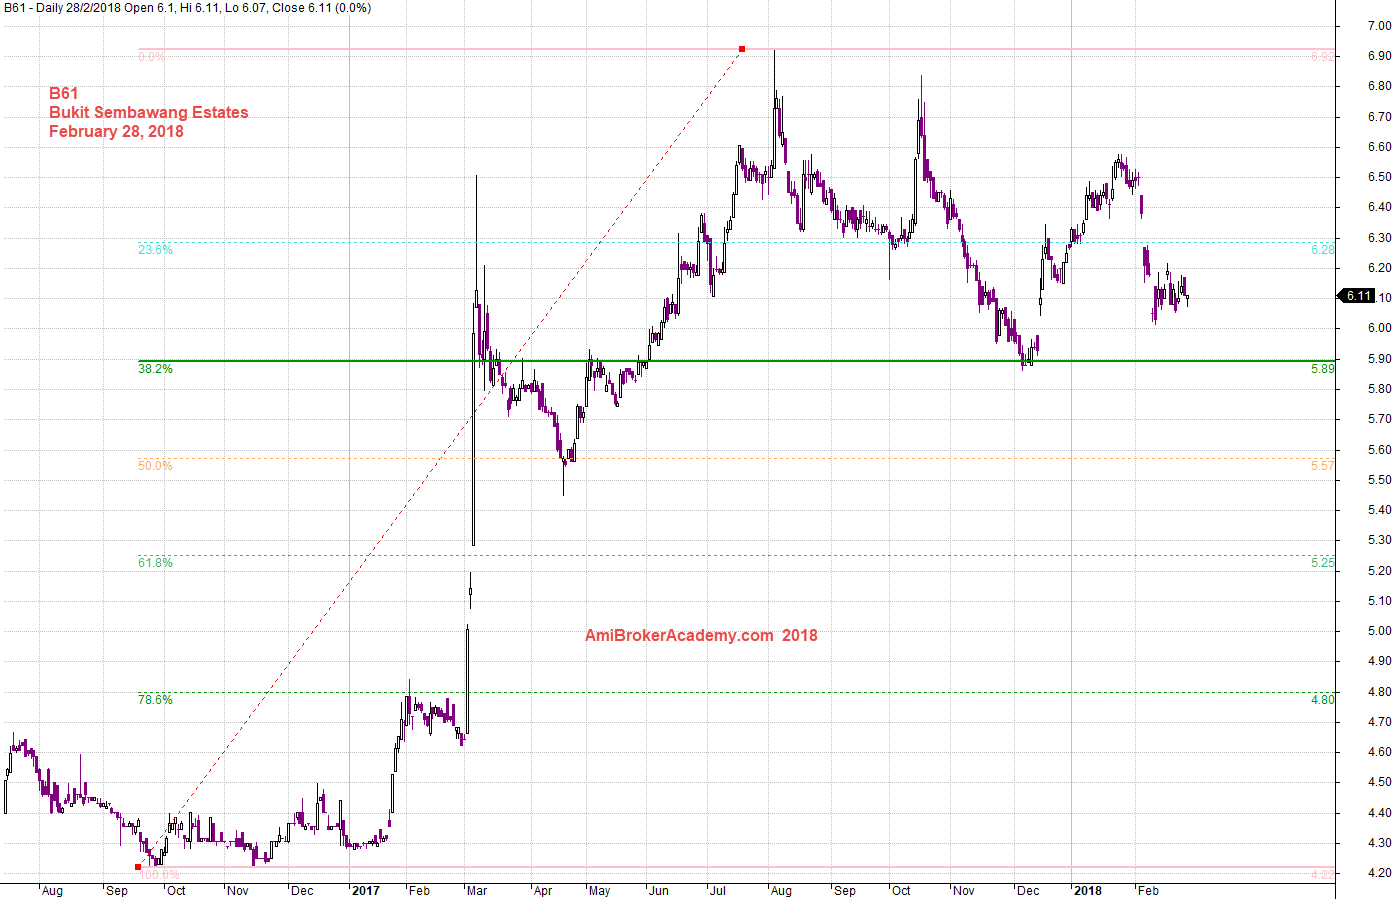
20180228 Bukit Sembawang Estates and Swing Low to High from September
Zoom In B61 Bukit Sembawang Estates and Fibonacci Retracement
Study chart for more, picture worth a thousand words, swing low to high draw Fibonacci Retracement, from April low to August high, the price retrace pass 61.8% and approaching 78.6% but fail. The price action retest the 61.8% again.
Manage your risk.
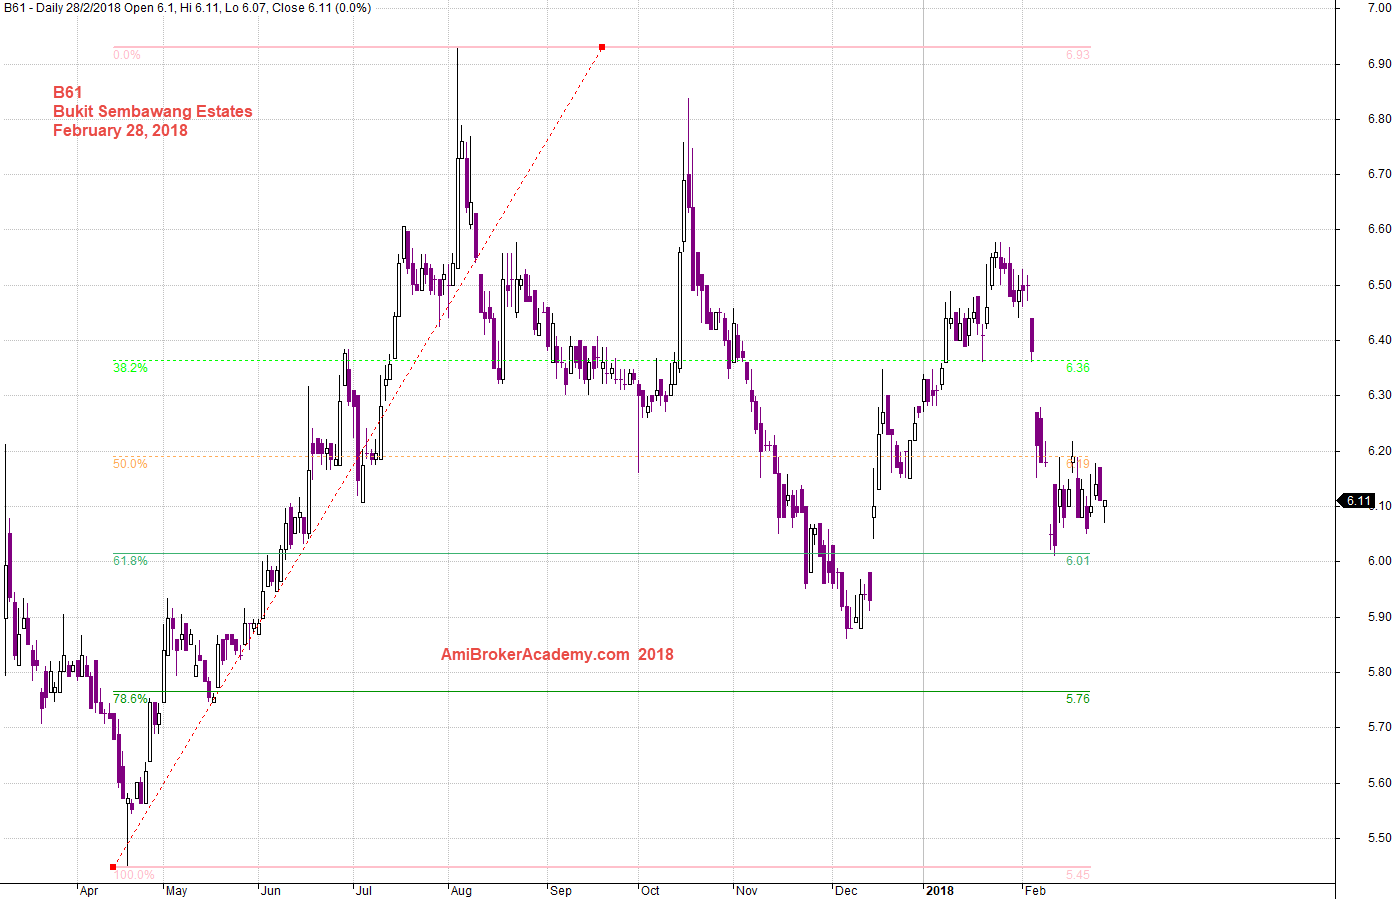
20180228 Bukit Sembawang Estates and Swing Low to High from April
B61 Bukit Sembawang Estates and Fibonacci Retracement From High to Low
If we take a different view, swing high to low, see chart for more.
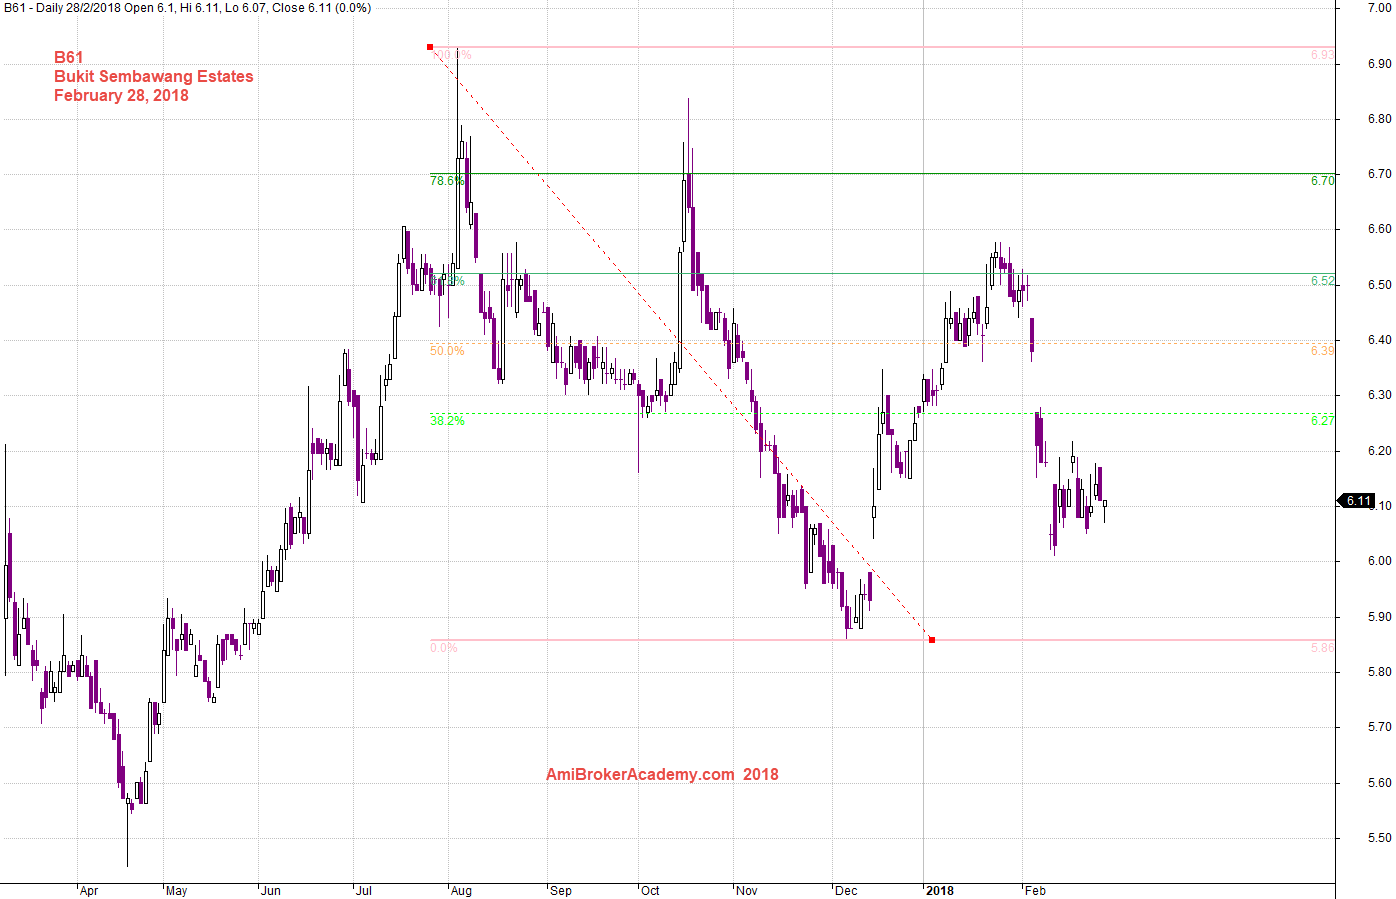
20180228 Bukit Sembawang Estates and Swing High to Low
B61 Bukit Sembawang Estates and Channel
See chart for more, the price action moving up to the next level, see channel.
Manage your risk.
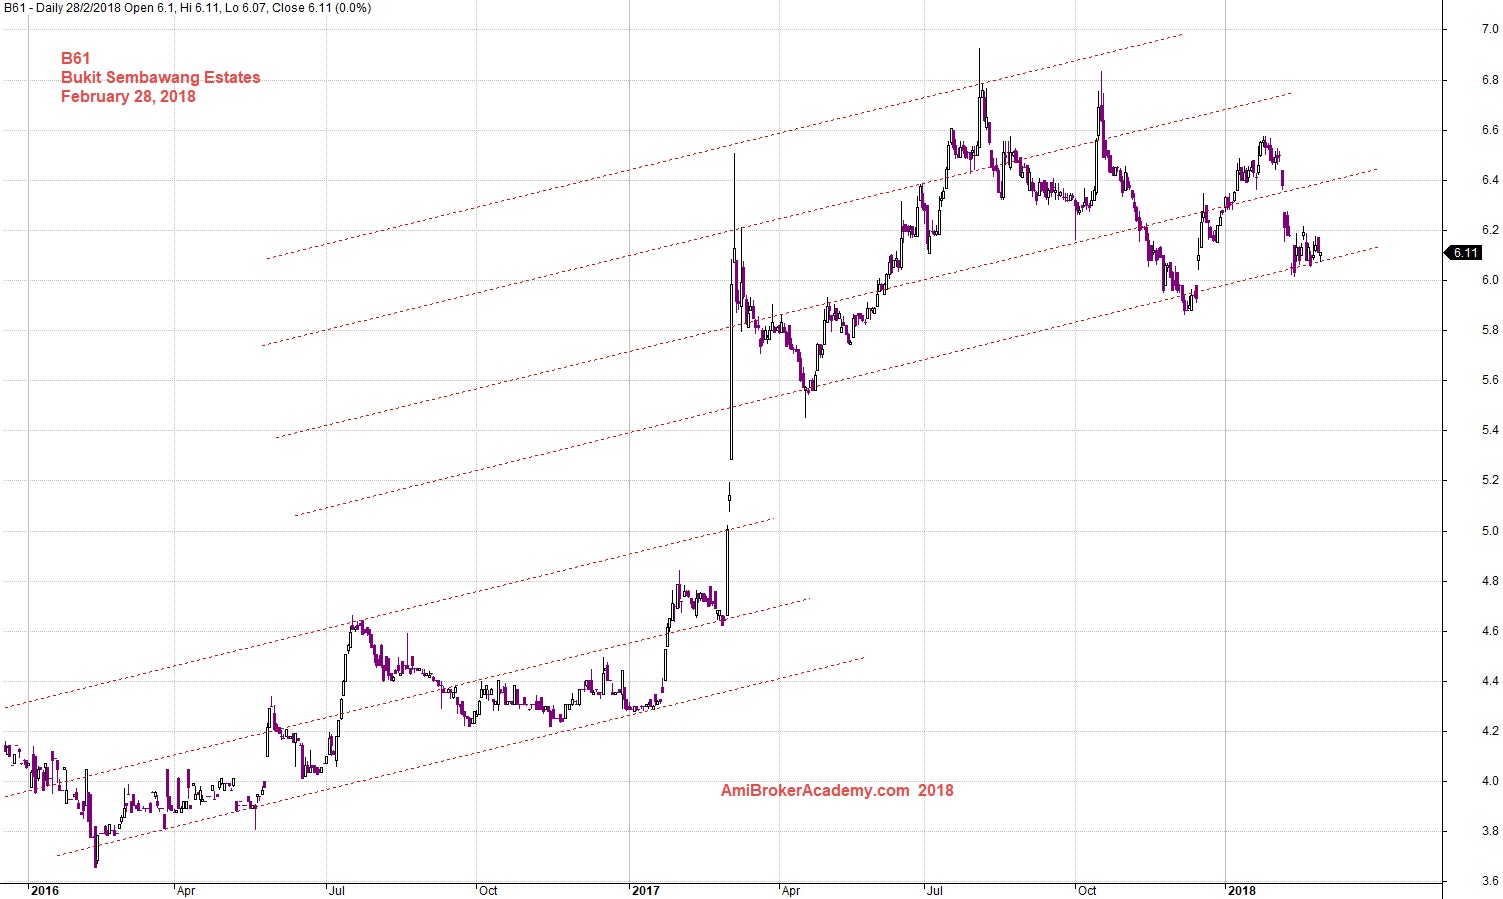
20180228 Bukit Sembawang Estates and Channel
Moses Singapore Stock Analysis
AmiBrokerAcademy.com
Disclaimer
The above result is for illustration purpose. It is not meant to be used for buy or sell decision. We do not recommend any particular stocks. If particular stocks of such are mentioned, they are meant as demonstration of Amibroker as a powerful charting software and MACD. Amibroker can program to scan the stocks for buy and sell signals.
These are script generated signals. Not all scan results are shown here. The MACD signal should use with price action. Users must understand what MACD and price action are all about before using them. If necessary you should attend a course to learn more on Technical Analysis (TA) and Moving Average Convergence Divergence, MACD.
Once again, the website does not guarantee any results or investment return based on the information and instruction you have read here. It should be used as learning aids only and if you decide to trade real money, all trading decision should be your own.