10 August, 2018
Singapore Stock Stories
Thanks for visiting the site.
AJBU Keppel DC REIT Charting
See chart, picture worth a thousand words. Study Keppel DC REIT stock price. See stock chart, the price action continue to form higher high until hit the peak at 1.48. Then we see the price action pullback and get supported near 1.32. The price action rebounce and retest the 1.48 and fail. The price comes back to retest 1.32. If you add a box between 1.48 and 1.32, monitor the breakout. It may be bullish or bearish. Trade with eyes open.
What will the the price action like for the next few days or weeks or maybe months? Will the stock price move even more low? Monitor the stock price. .
Manage your risk.
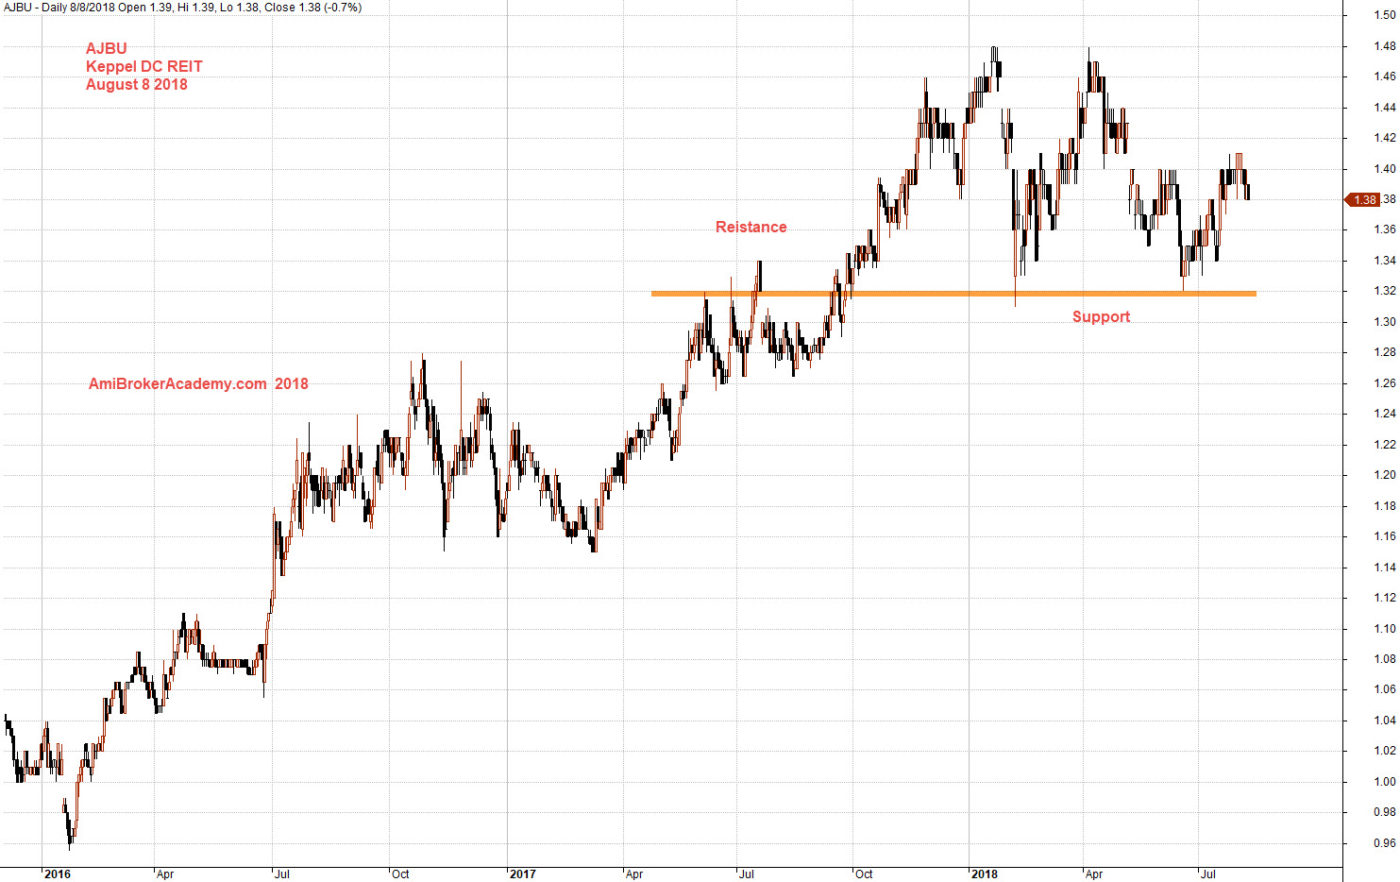
August 8, 2018 Keppel DC REIT Support Resistance
AJBU Keppel DC REIT and Six Months Support Resistance
Picture worth a thousand words, see chart. After 2017, the price action begin to show resisted.
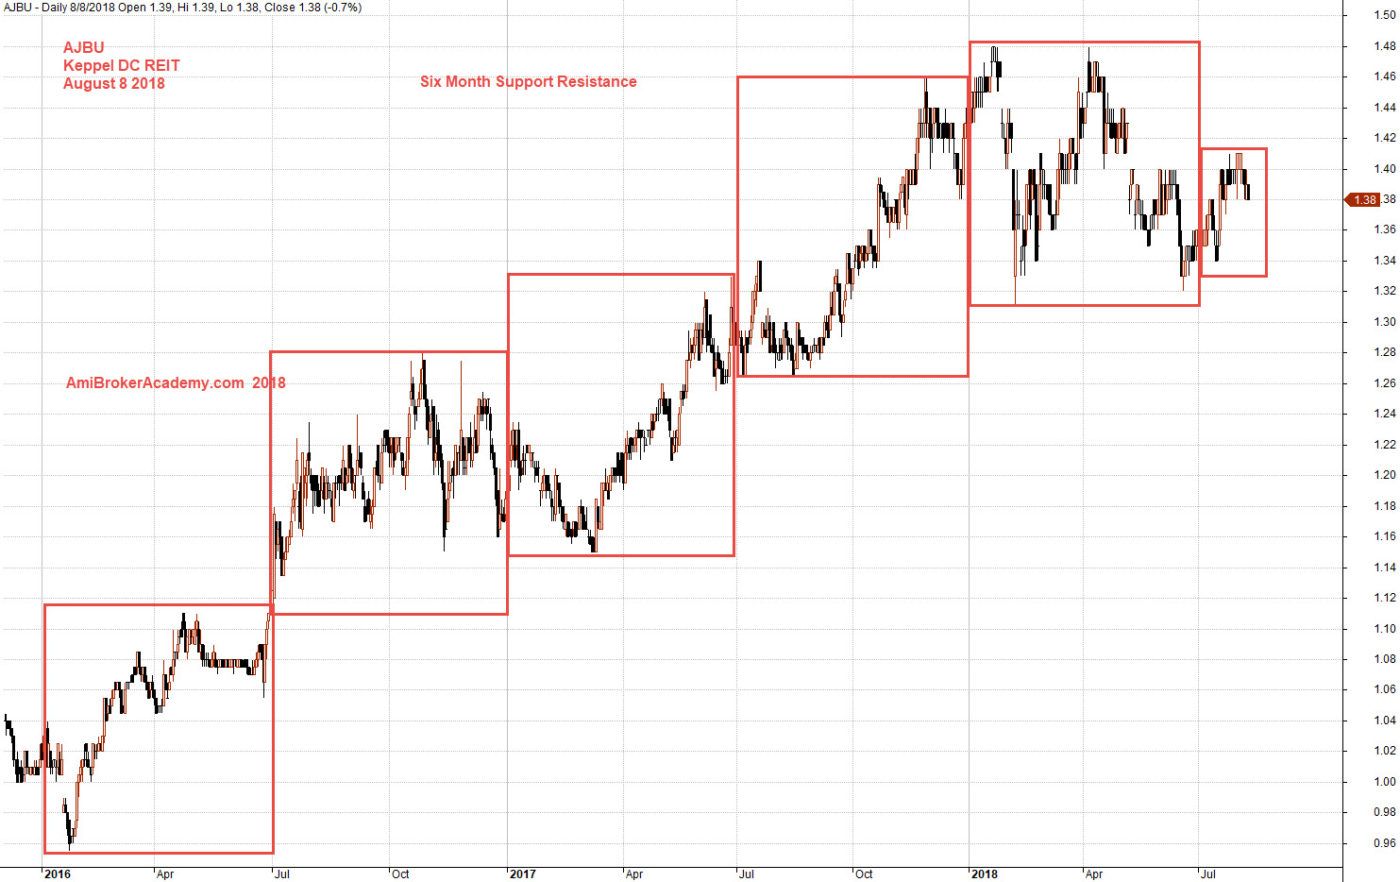
August 8, 2018 Keppel DC REIT Six Months Support Resistance
Moses
AmiBrokerAcademy.com
Disclaimer
The above result is for illustration purpose. It is not meant to be used for buy or sell decision. We do not recommend any particular stocks. If particular stocks of such are mentioned, they are meant as demonstration of Amibroker as a powerful charting software and MACD. Amibroker can program to scan the stocks for buy and sell signals.
These are script generated signals. Not all scan results are shown here. The MACD signal should use with price action. Users must understand what MACD and price action are all about before using them. If necessary you should attend a course to learn more on Technical Analysis (TA) and Moving Average Convergence Divergence, MACD.
Once again, the website does not guarantee any results or investment return based on the information and instruction you have read here. It should be used as learning aids only and if you decide to trade real money, all trading decision should be your own.