9 October 2018
Singapore Stock Stories
Thanks for visiting the site.
This is fourth in our study of those companies IPO in 2017 and 2018. We will like to see how the stock perform if you happen to own the stock right at IPO time.

RE&S Holdings
1G1 RE&S Holdings Charting
Study Support Resistance and Apply Buy Low Sell High Strategy
To maximize your profit and minimize risk is to apply buy low sell high strategy, in order to apply the strategy you have to identify the support resistance. Study RE&S Holdings stock chart, picture worth a thousand words.
If you apply the Buy Hold Strategy, what will happen? Although the years are still young for such strategy.
Trade with eyes open.
Manage your risk.
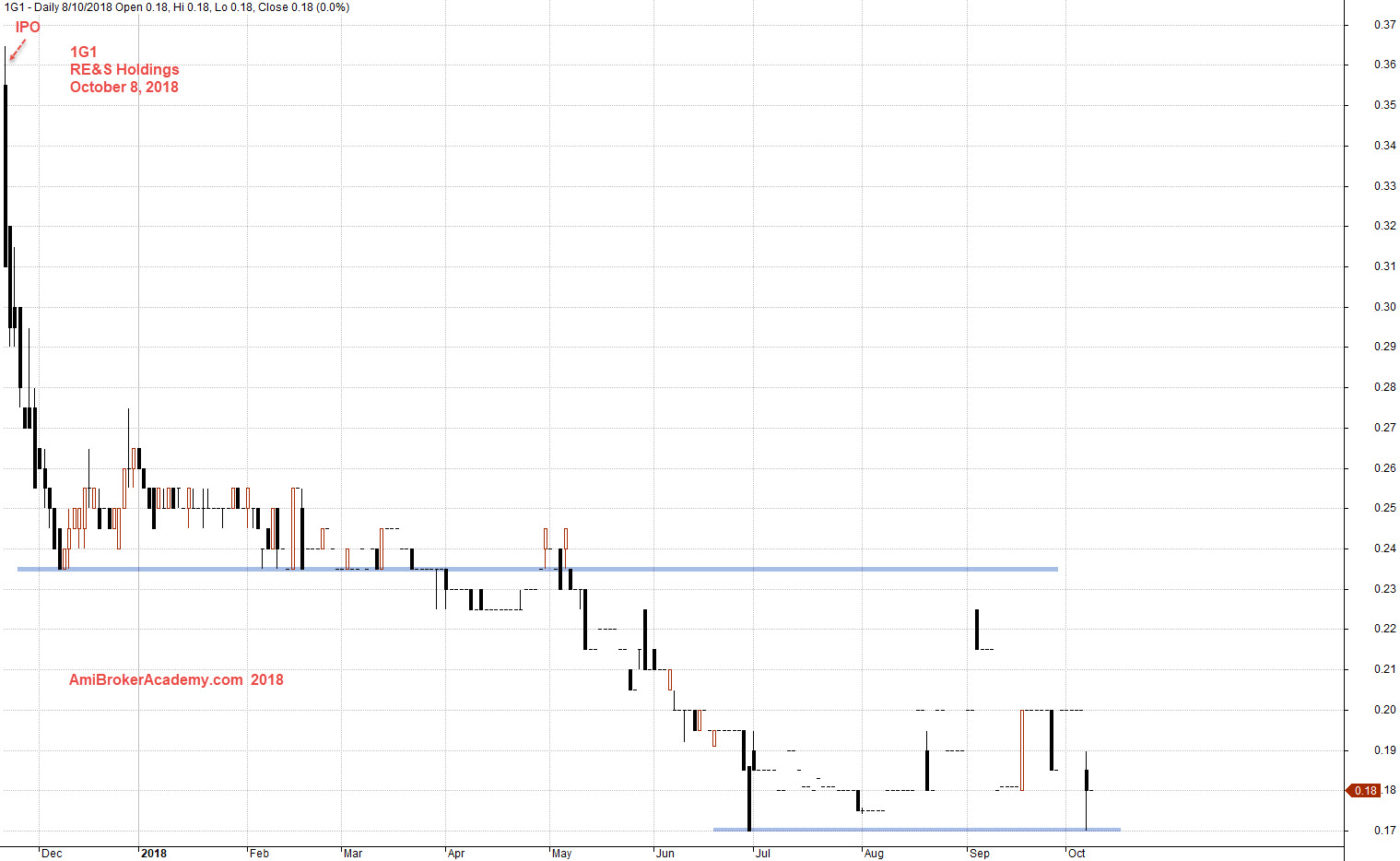
October 8, 2018 RE&S Holdings from IPO
If you can see the whole chart, “press Ctrl and -” to zoom out.
Add MACD indicator, see chart, picture worth a thousand words. Trade with eyes open. Manage your risk.
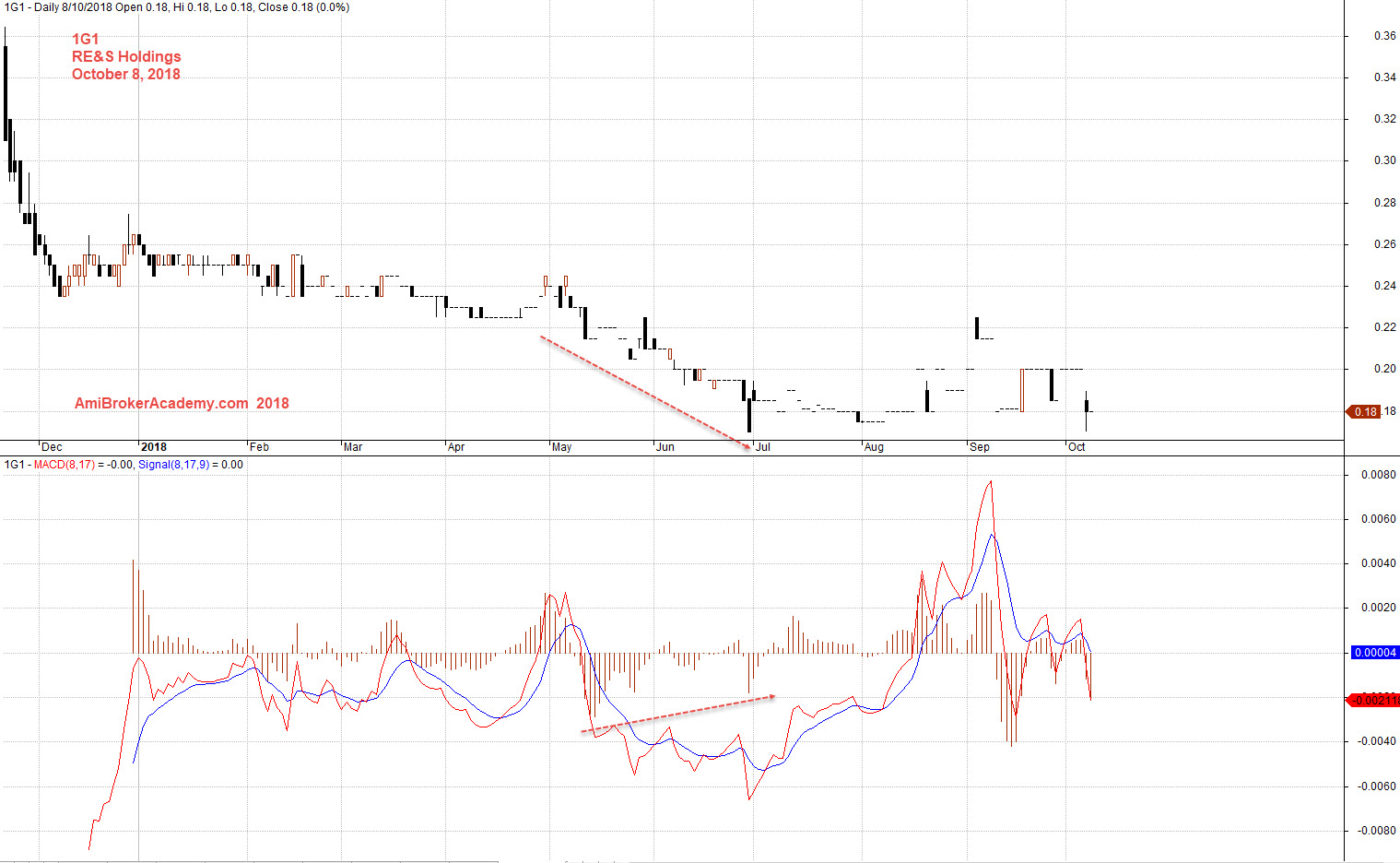
October 8, 2018 RE&S Holdings and MACD
Moses
AmiBrokerAcademy.com – we are different
Disclaimer
The above result is for illustration purpose. It is not meant to be used for buy or sell decision. We do not recommend any particular stocks. If particular stocks of such are mentioned, they are meant as demonstration of Amibroker as a powerful charting software and MACD. Amibroker can program to scan the stocks for buy and sell signals.
These are script generated signals. Not all scan results are shown here. The MACD signal should use with price action. Users must understand what MACD and price action are all about before using them. If necessary you should attend a course to learn more on Technical Analysis (TA) and Moving Average Convergence Divergence, MACD.
Once again, the website does not guarantee any results or investment return based on the information and instruction you have read here. It should be used as learning aids only and if you decide to trade real money, all trading decision should be your own.