13 August 2021
Welcome!
Welcome to AmiBroker Academy dot com, amibrokeracademy.com.

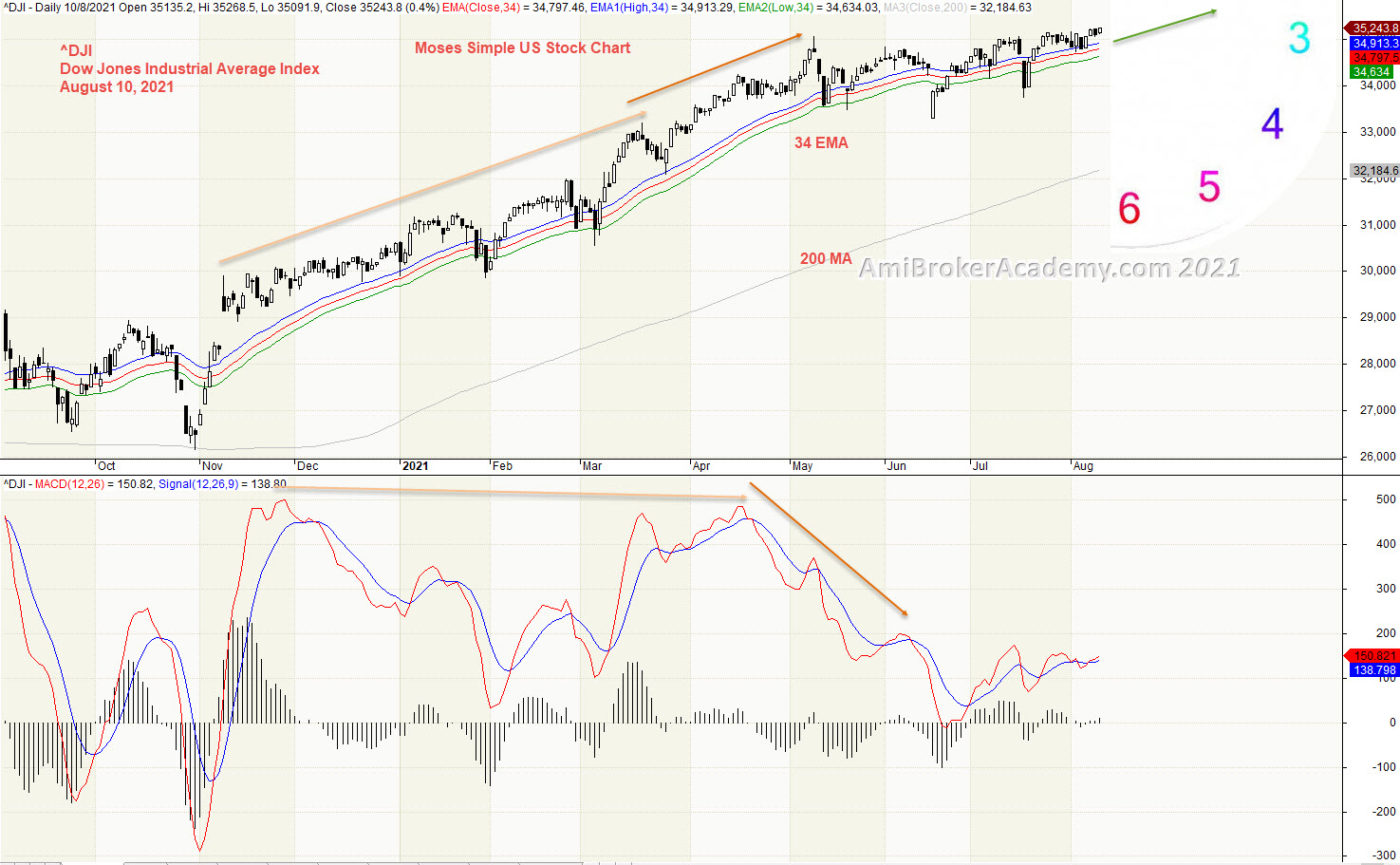
1) ^DJI | Dow Jones Industrial Average Index
Study Dow Jones Industrial Average Index price action. We use moving averages, moving average is a good visual tool. Raghee uses 34 EMA, high, low and close moving averages to study the wave direction. We call the three MAs band as River. Besides study the wave direction. We be used to measure support and resistance. River resist when price action below the River. River support when price action above the River. Bull trend, when the price action slopping up. Bear trend, when the price action slopping down.
One trick is to wait for price action to draw near the River. this will reduce the risk and increase the entry success rate. But, there are always fail situation, manage your risk.
See chart, we find the price action continues to be supported by River. River is pointing between two and three o’clock.
Remember, we just read what the chart said. Have fun!
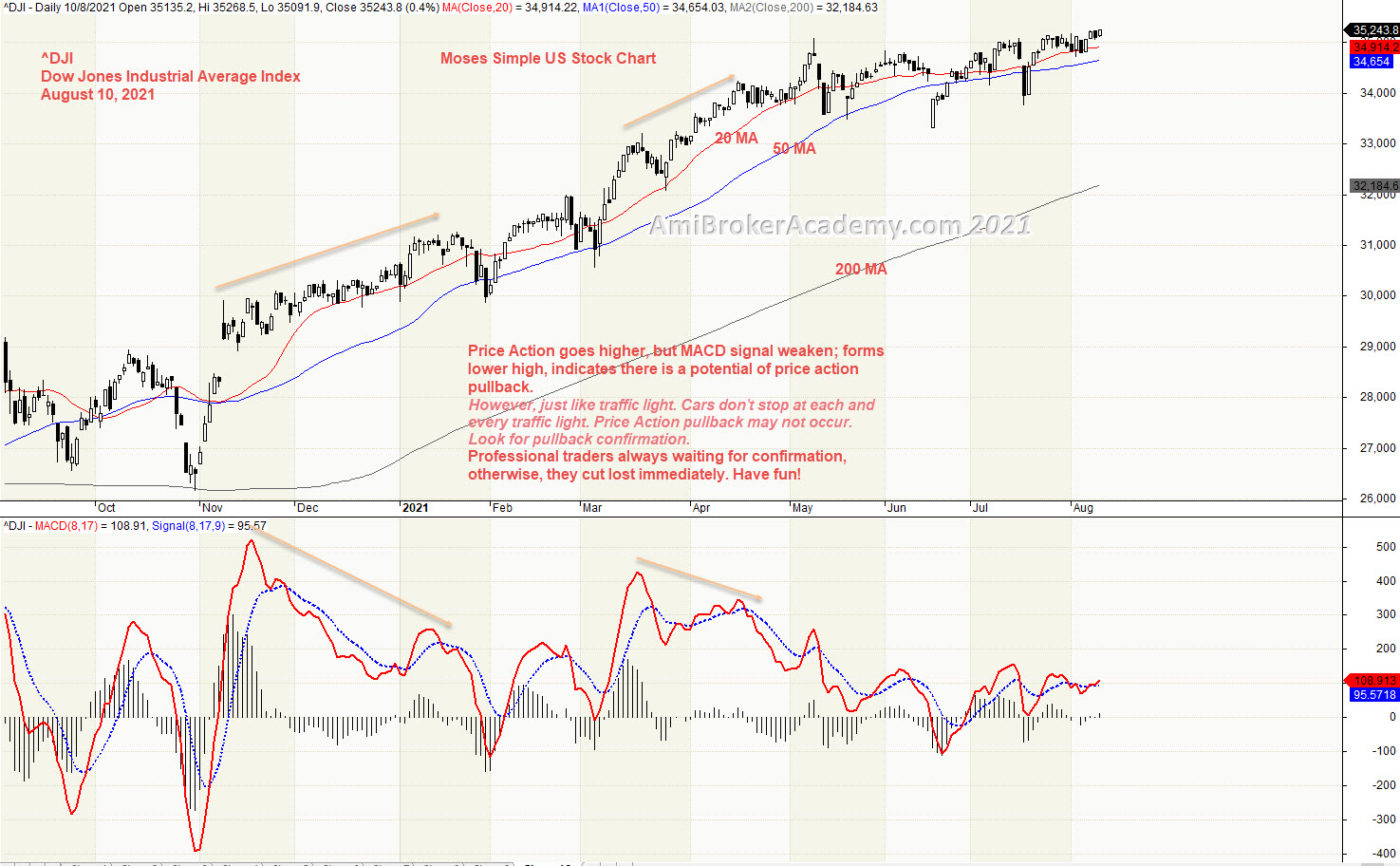
2) Dow Jones Industrial Average Index and MACD
In AmiBroker charting software, it is very easy to add ore remove any indicator. See chart, we add MACD indicator.
MACD is a very simple indicator, one approach is to study the price action strength with the MACD. When price action goes higher and strong, but MACD goes the opposite. In hints that the price action strength is weaken. There is a potential of price action pullback.
However, MACD is like traffic light, Traffic light is install at each junction to signal a potential flow direction change. Cars don’t stop at each traffic light, but there is a possibility of stop. It is true for price action and MACD. Price Action may be pullback in response to the MACD Divergence.
Remember to buy support sell resistance whenever that is possible.
Trade with eyes open.
Manage your risk.
Moses Power Charting
Official AmiBrokerAcademy.com Charting
Disclaimer
The above result is for illustration purpose. It is not meant to be used for buy or sell decision. We do not recommend any particular stocks. If particular stocks of such are mentioned, they are meant as demonstration of Amibroker as a powerful charting software and MACD. Amibroker can program to scan the stocks for buy and sell signals.
These are script generated signals. Not all scan results are shown here. The MACD signal should use with price action. Users must understand what MACD and price action are all about before using them. If necessary you should attend a course to learn more on Technical Analysis (TA) and Moving Average Convergence Divergence, MACD.
Once again, the website does not guarantee any results or investment return based on the information and instruction you have read here. It should be used as learning aids only and if you decide to trade real money, all trading decision should be your own.
We learn from many past and present great traders. Kudo to these master.