September 21, 2017
Again on the topic of Support Resistance
The following is taken from babypips.com on support resistance.
Plotting Forex Support and Resistance
One thing to remember is that support and resistance levels are not exact numbers.
Often times you will see a support or resistance level that appears broken, but soon after find out that the market was just testing it.
Support Resistance is one of the most widely used tool in trading.
Strangely enough, everyone seems to have their own idea on how you should measure support resistance.
Depending on how you understand support resistance. Each of the mountain is the resistance, as at that point the level act like a ceiling for the price action. The price can not move any further to the high.
And it is also true for the valley, as at that point the price can not fall any further down. The level act as a floor for the price action.
Significant Level
Support Resistance is not the necessary the significant level, significant level refers to the level where many of the price action got resisted or supported, and resistance turns support or support get supported again. In short, significant level is one of the support or resistance.
^BKX NASDAQ Bank Index and Significant Level
Here’s an example of NASDAQ Bank Index which we see number of significant level. See chart for more, as picture worth a thousand words.
Topping
When the price action keep testing the similar high, resistance; topping. Why topping? As the test keep failling, the price action can not breakout higher.
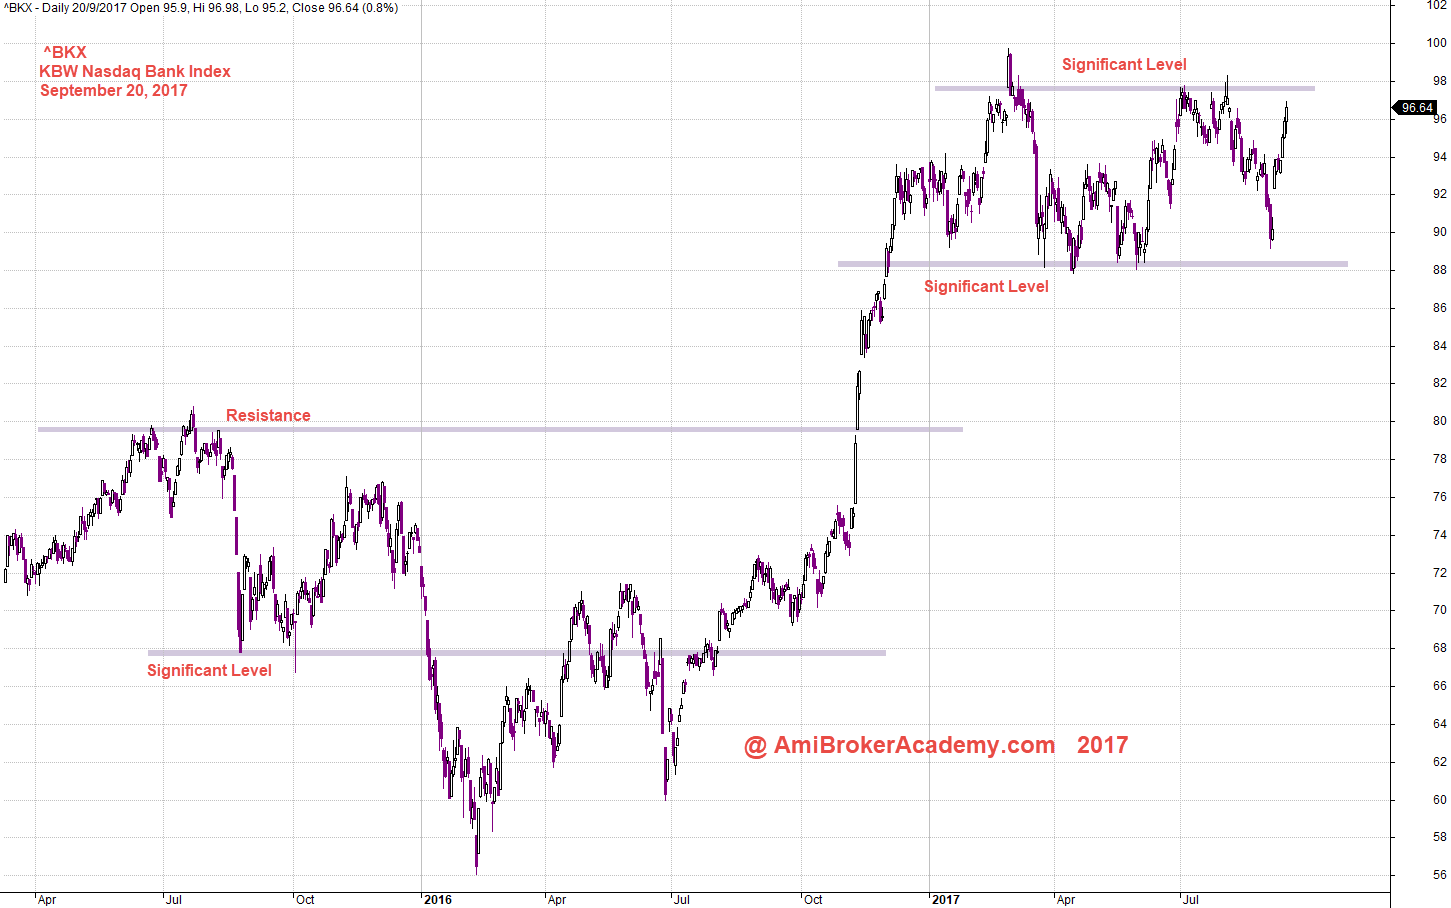
September 20, 2017 KBW NASDAQ Bank Index and Support Resistance and Significant Level
Moses
AmiBrokerAcademy.com
Disclaimer
The above result is for illustration purpose. It is not meant to be used for buy or sell decision. We do not recommend any particular stocks. If particular stocks of such are mentioned, they are meant as demonstration of Amibroker as a powerful charting software and MACD. Amibroker can program to scan the stocks for buy and sell signals.
These are script generated signals. Not all scan results are shown here. The MACD signal should use with price action. Users must understand what MACD and price action are all about before using them. If necessary you should attend a course to learn more on Technical Analysis (TA) and Moving Average Convergence Divergence, MACD.
Once again, the website does not guarantee any results or investment return based on the information and instruction you have read here. It should be used as learning aids only and if you decide to trade real money, all trading decision should be your own.
https://www.babypips.com/learn/forex/support-and-resistance