27 June 2021
Welcome!
Welcome to AmiBroker Academy dot com, amibrokeracademy.com.
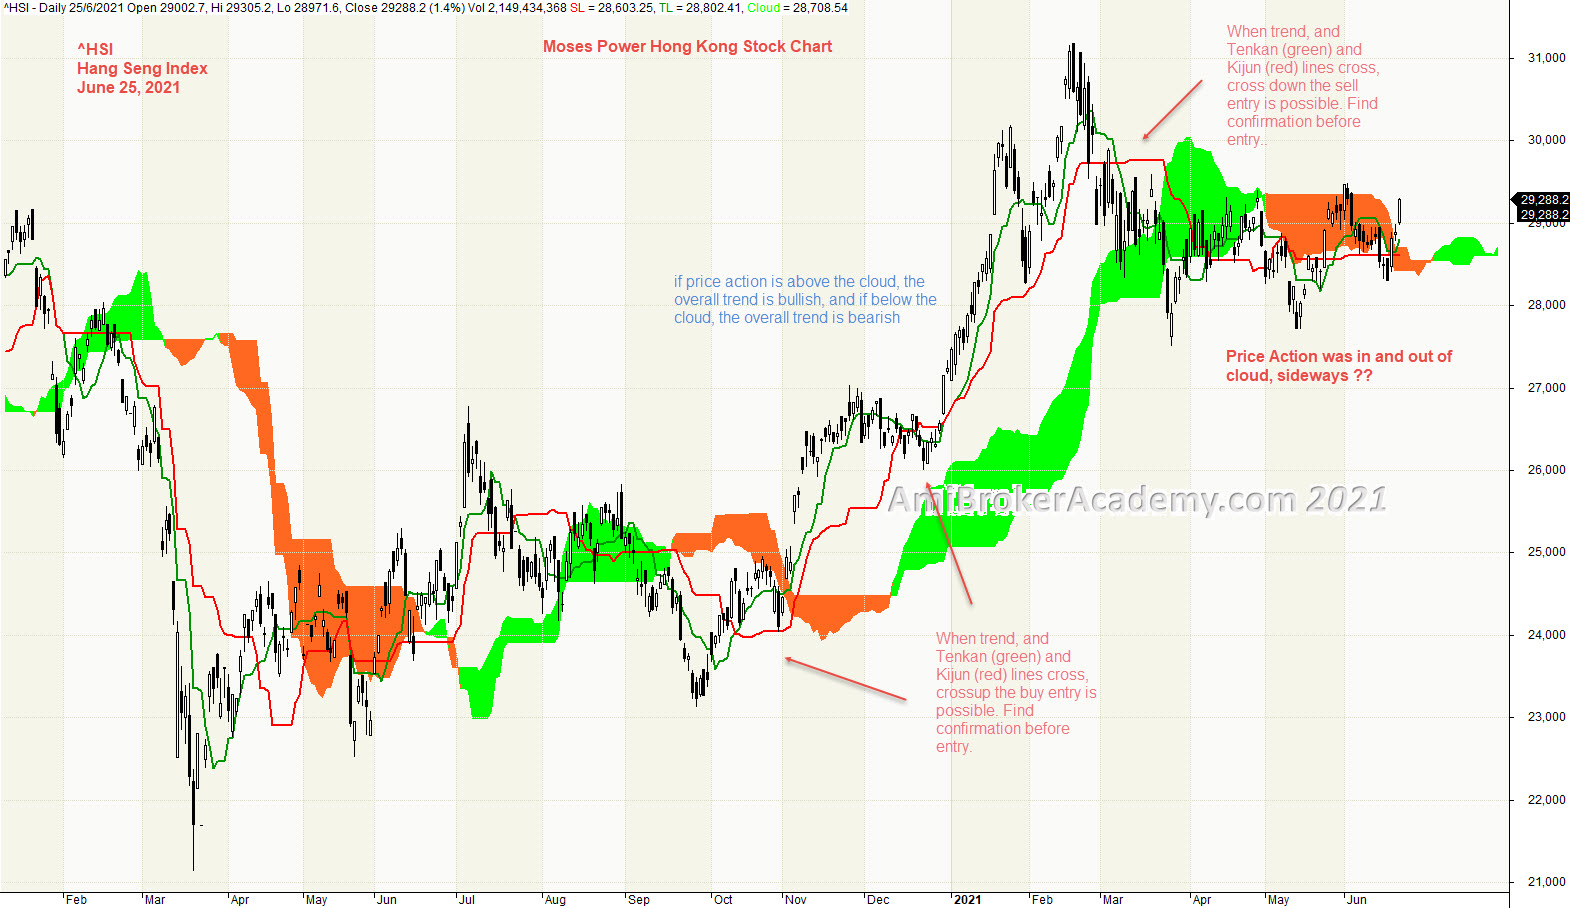
^HSI | Hang Seng Index
Study Hang Seng Index and Ichimoku Cloud.
Trade what you see.
Manage risk is a key in trading.
Moses Free Charting
Hong Kong Hang Seng Index and Ichimoku Cloud
Ichimoku Cloud is a multi-dimensional indicator designed to offer support and resistance levels, trending, and entry and exit points. When price action is above the cloud, the overall trend is bullish, and if below the cloud, the overall trend is bearish.
Tenkan crossing up from underneath the Kijun as a bullish signal, and Tenkan crossing from overhead down under Kijun giving a bearish signal.
When trend, and Tenkan (green) and Kijun (red) lines cross, crossup the buy entry is possible. Find confirmation before entry. And Tenkan (green) and Kijun (red) lines cross, cross under below the sell entry is possible. Wait for confirmation before entry.
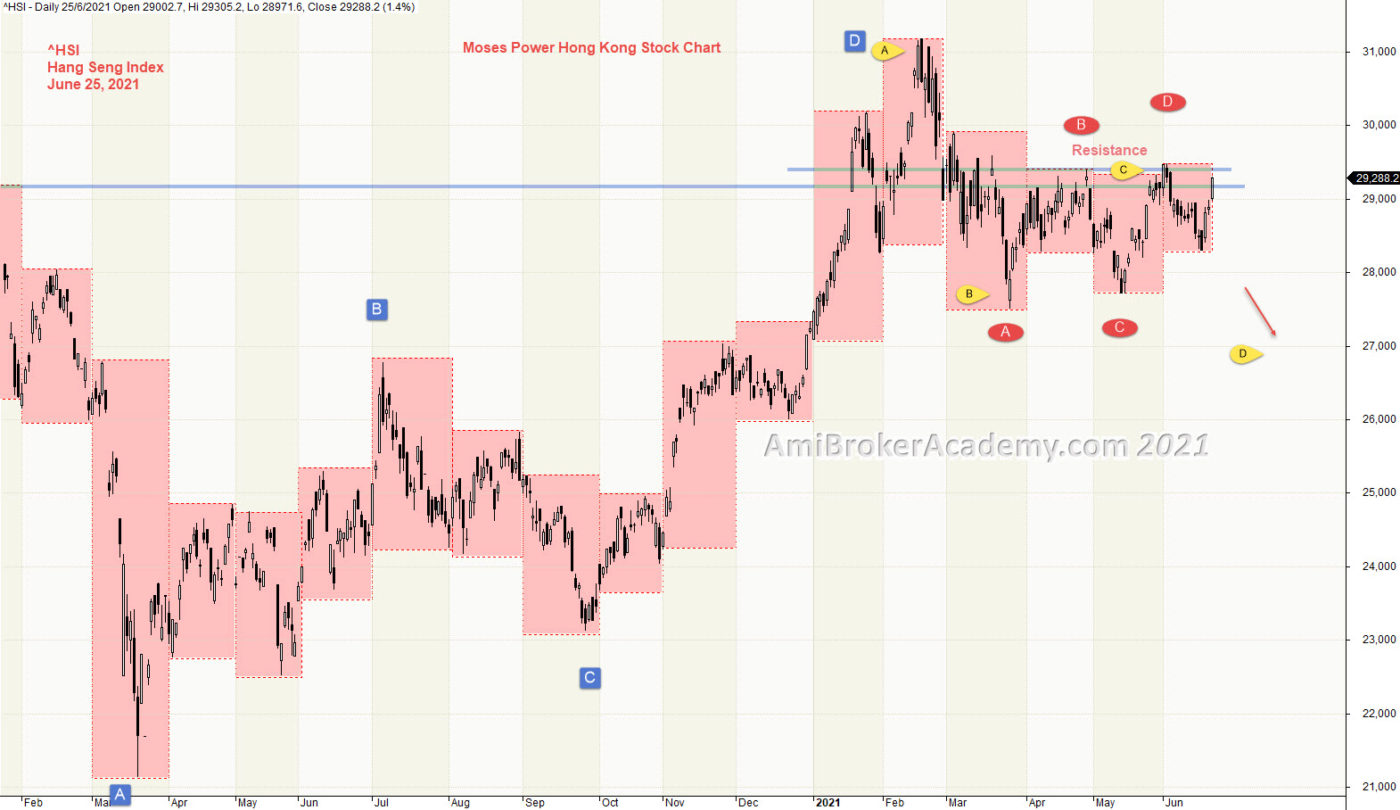
Hang Seng Index and Support Resistance
Price Action has breakout from resistance, but deep again.
Remember to buy support and sell resistance. Trade what you see (visual). See also the ABCD wave movement.
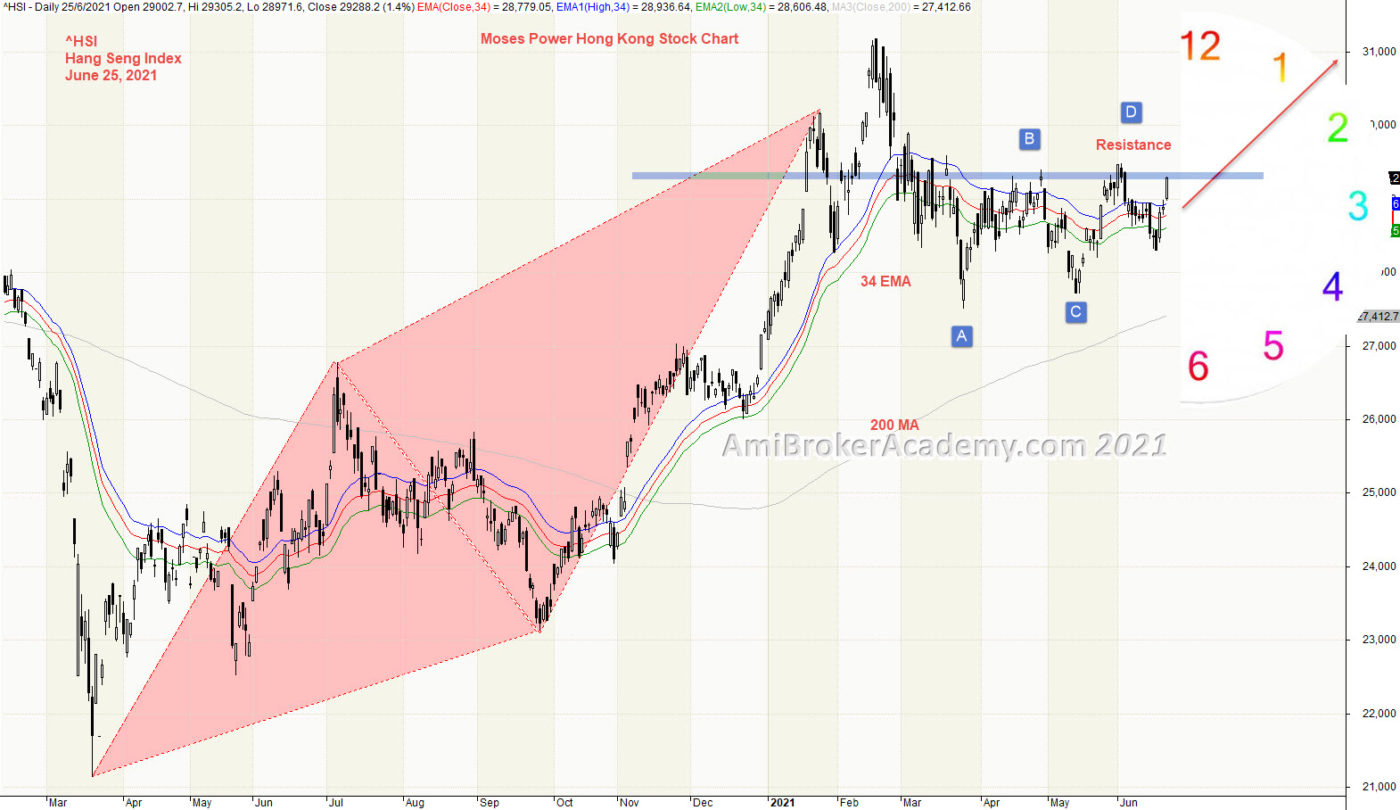
Hang Seng Index and River
River is a great visual aid. But, but he last part, the price action zipping up and down of River, 34 EMA. Price Action could be sideways. Will the sideways continue.
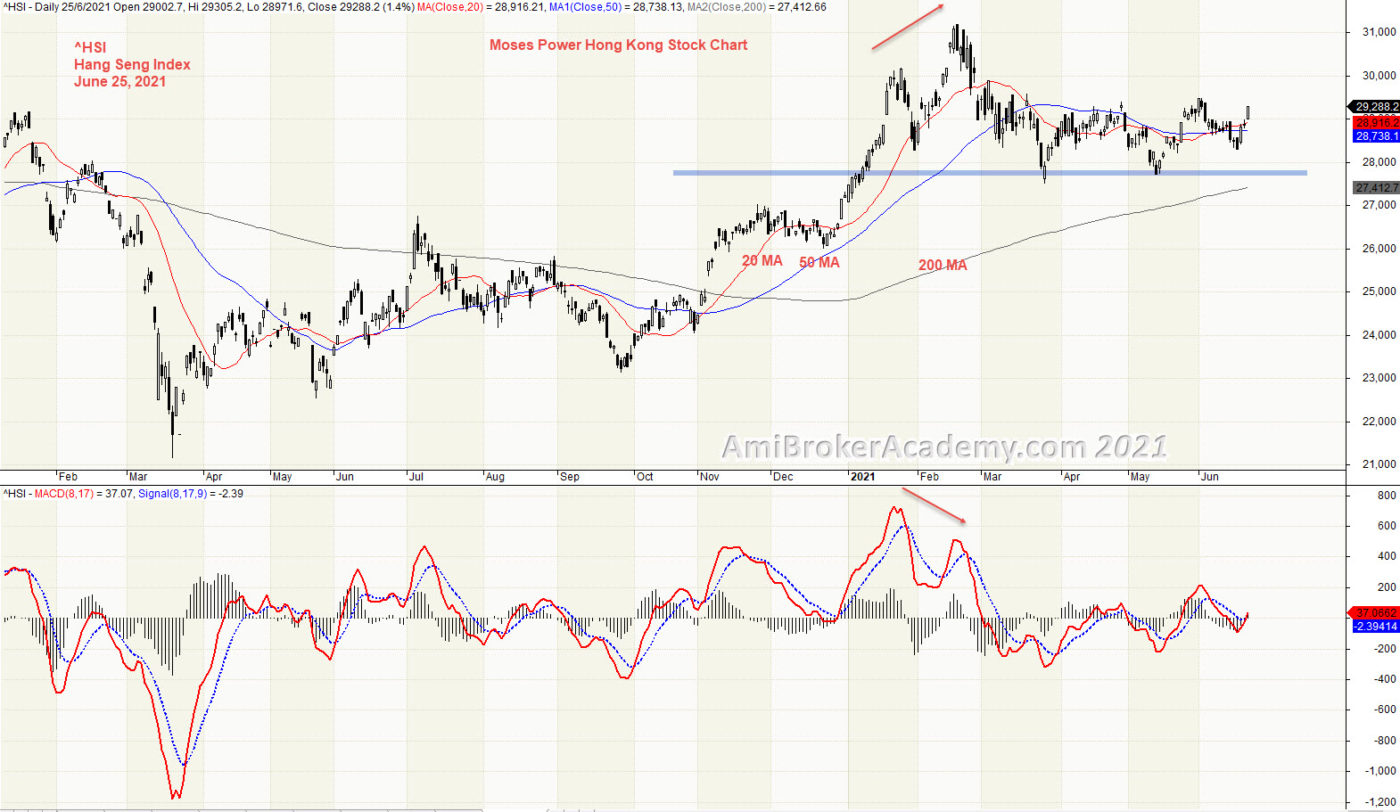
Hang Seng Index and MACD
We see 20 and 50 MA are begin to converge, sideways. Redraw the support resistance line, we see price action supported by the horizontal line.
Hang Seng Index and GMMA and Woodies CCI
GMMA reconfirm the sideways momentum. Fast MA zipping up and down the Slow MA. Trade what you see.

Moses Power Charting
Official AmiBrokerAcademy.com Charting
Disclaimer
The above result is for illustration purpose. It is not meant to be used for buy or sell decision. We do not recommend any particular stocks. If particular stocks of such are mentioned, they are meant as demonstration of Amibroker as a powerful charting software and MACD. Amibroker can program to scan the stocks for buy and sell signals.
These are script generated signals. Not all scan results are shown here. The MACD signal should use with price action. Users must understand what MACD and price action are all about before using them. If necessary you should attend a course to learn more on Technical Analysis (TA) and Moving Average Convergence Divergence, MACD.
Once again, the website does not guarantee any results or investment return based on the information and instruction you have read here. It should be used as learning aids only and if you decide to trade real money, all trading decision should be your own.
We learn from many past and present great traders. Kudo to these master.