March 18, 2018
Think Think Got More Things
In order to make trade plan, we always think think, and think think got more things. We will study the chart from different angle to under the price action and the momentum. See below the illustration using Index, 000001.ss.
Shanghai Stock Chart Analysis
000001.SS China Shanghai Stock Exchange Composite Index and Fibonacci Levels
Study chart, study Fibonacci levels, see swing low to high, Fibonacci Extension, We see Shanghai Stock Exchange Composite Index pullback to 50% Fibo level, retest the same high, and retest the 50% level again before the bull push the index all the way to 127%. Then resistance turns support, the price action hits 150% resistance. The price action has a big drop to nearly retest 50% level again. Now the price action get resisted by the resistance turns support level again. See chart for more, picture worth a thousand words.
Manage your risk!
Powerful Chart Software – AmiBroker
The following chart is produced using AmiBroker charting software. It is a powerful chart software. Anything, finance ticket you could download from Yahoo! Finance you could plot them, those you are interested all in a chart, so you could analyse them.
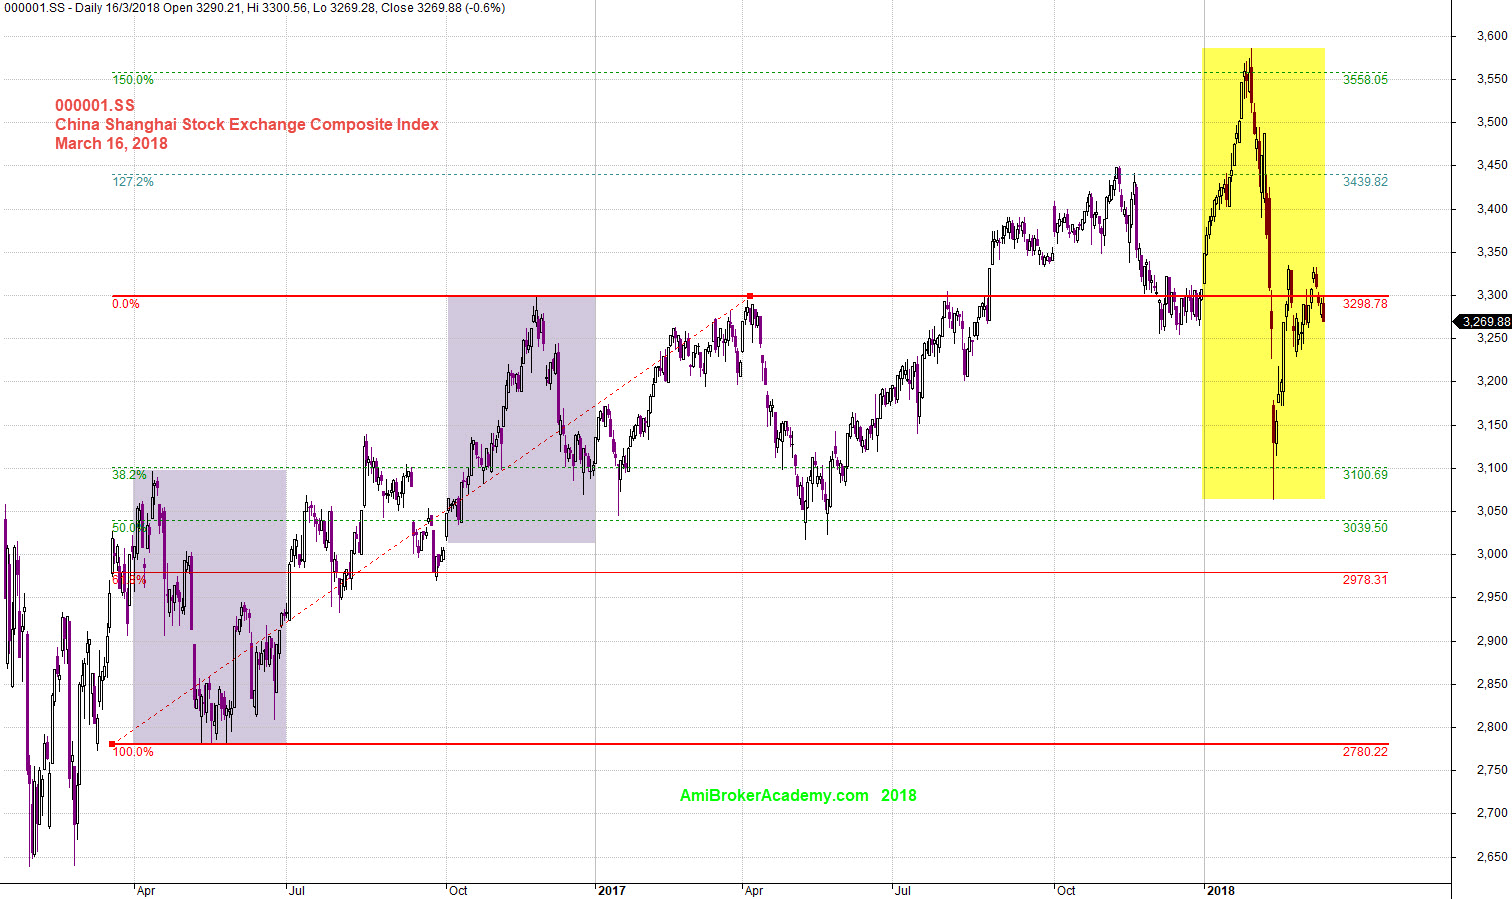
March 16, 2018 Shanghai Stock Exchange Composite Index and Fibo Extension Swing Low to High
Moses China Stock Chart Analysis
AmiBrokerAcademy.com
Disclaimer
The above result is for illustration purpose. It is not meant to be used for buy or sell decision. We do not recommend any particular stocks. If particular stocks of such are mentioned, they are meant as demonstration of Amibroker as a powerful charting software and MACD. Amibroker can program to scan the stocks for buy and sell signals.
These are script generated signals. Not all scan results are shown here. The MACD signal should use with price action. Users must understand what MACD and price action are all about before using them. If necessary you should attend a course to learn more on Technical Analysis (TA) and Moving Average Convergence Divergence, MACD.
Once again, the website does not guarantee any results or investment return based on the information and instruction you have read here. It should be used as learning aids only and if you decide to trade real money, all trading decision should be your own.