December 25, 2017
Shanghai Stock Analysis
600739.SS Cheng DA 辽宁成大 Data Since 2014
We like to step back and see the chart with more data. We see Cheng DA chart from 2014.
Powerful Chart Software – AmiBroker
The following chart is produced using AmiBroker charting software. It is a powerful chart software.
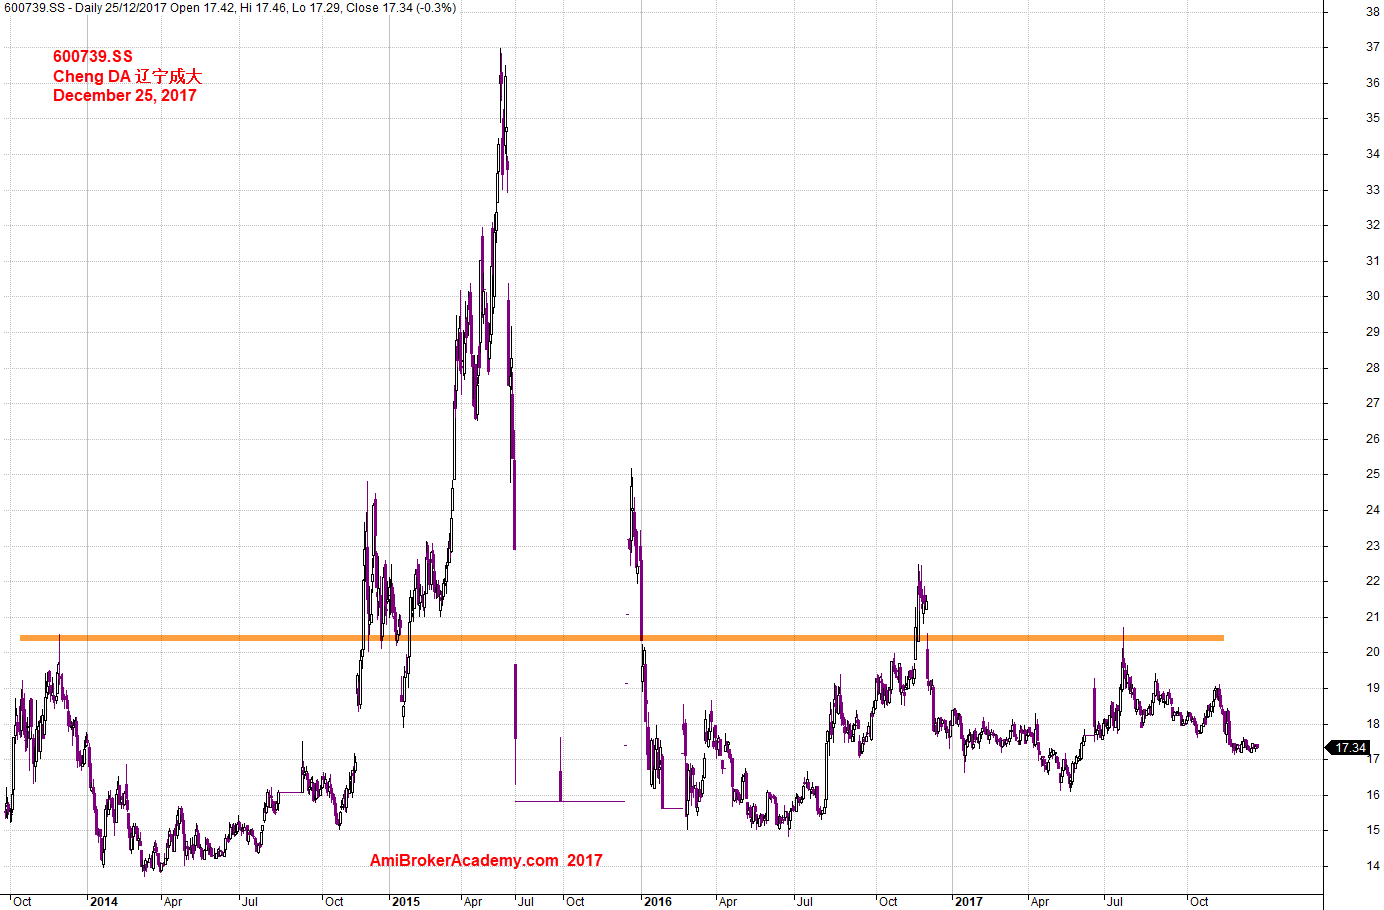
December 25, 2017 Cheng-DA-辽宁成大-Data-Since-2014
600739.SS Cheng DA 辽宁成大 Charting
See chart, with the key level. The level has been test and retest many times.
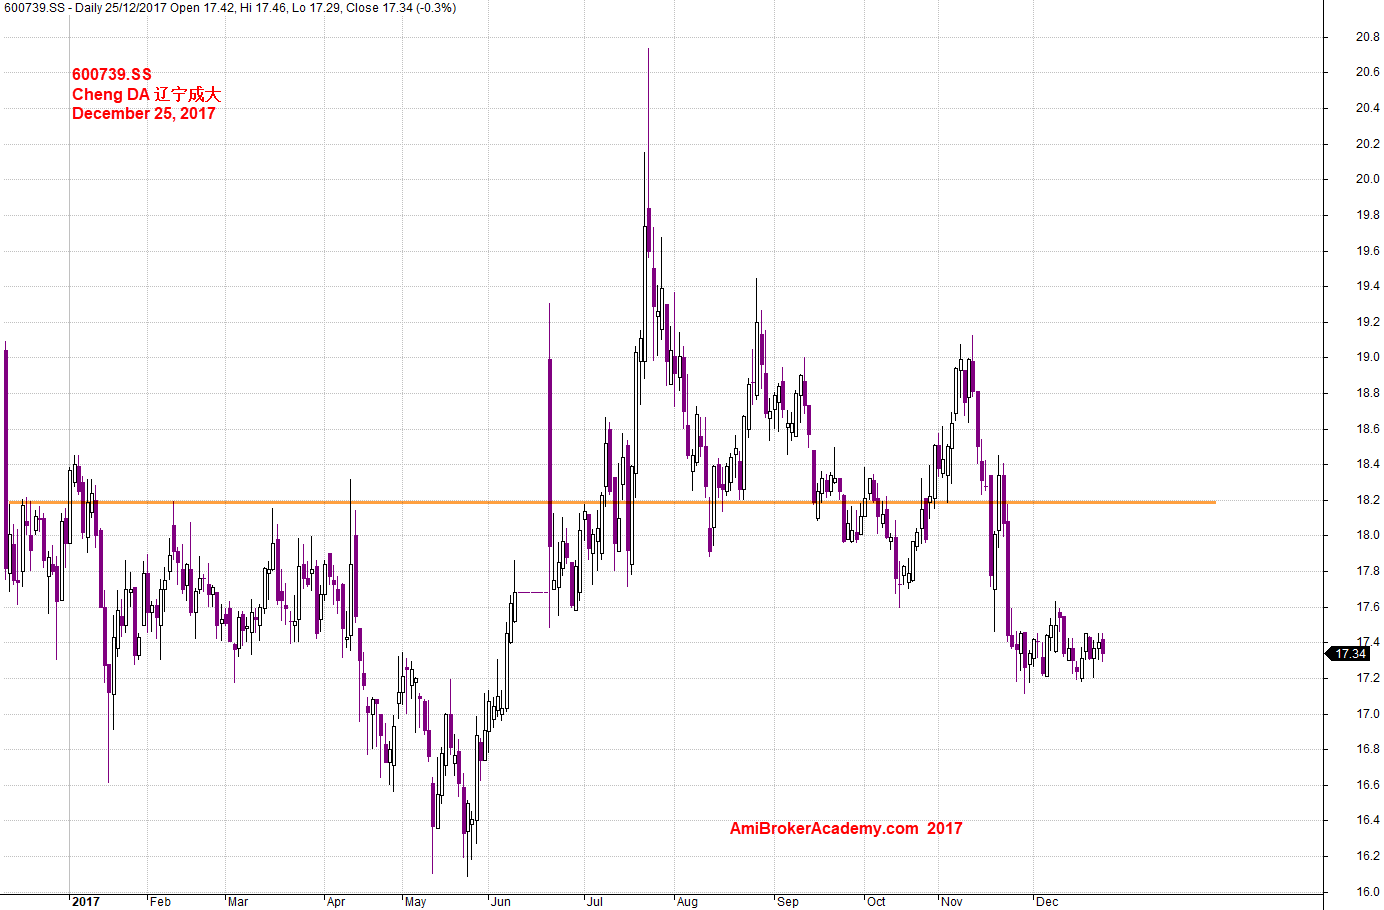
December 25, 2017 Cheng-DA-Charting
Moses
AmiBrokerAcademy.com
Disclaimer
The above result is for illustration purpose. It is not meant to be used for buy or sell decision. We do not recommend any particular stocks. If particular stocks of such are mentioned, they are meant as demonstration of Amibroker as a powerful charting software and MACD. Amibroker can program to scan the stocks for buy and sell signals.
These are script generated signals. Not all scan results are shown here. The MACD signal should use with price action. Users must understand what MACD and price action are all about before using them. If necessary you should attend a course to learn more on Technical Analysis (TA) and Moving Average Convergence Divergence, MACD.
Once again, the website does not guarantee any results or investment return based on the information and instruction you have read here. It should be used as learning aids only and if you decide to trade real money, all trading decision should be your own.