November 26, 2018
Thanks for visiting the site.
Shanghai Stock Analysis
600354.SS Gansu Dunhuang Seed Co 敦煌种业 Stock Charting
Let’s discuss Gansu Dunhuang Seed Co 敦煌种业 stock, see chart. We study the month high low in 2018. The stock price goes to the peak to 9.2 RMB in 2018, and decline to the low 3.4 RMB. From the month high low we observe a strong support level near 5 RMB, the price action pressure increase to finally breakout below the support. See chart, picture worth a thousand words.
Trade with your eyes open. Manage your trade.
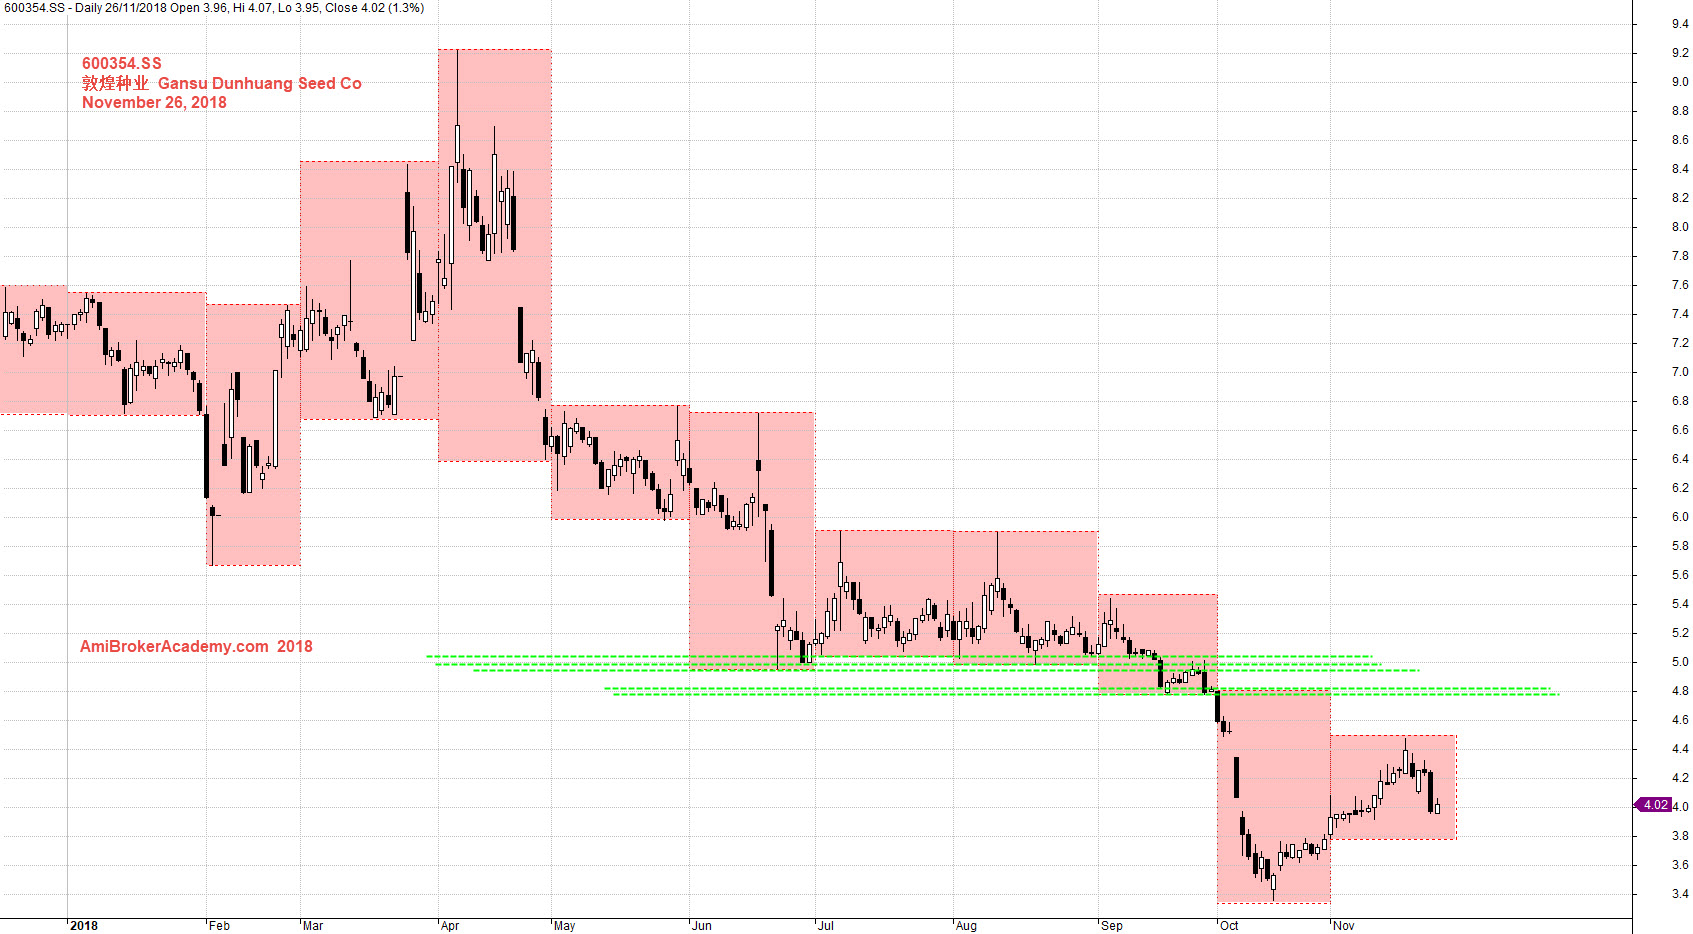
November 26, 2018 敦煌种业 Gansu Dunhuang Seed Co and Month High Low
Imaging you zoom out, and study the stock chart with the 200 MA. Moving Average is a great visual tool. Price Action was started above 200 Moving Average, next the price action close below 200 MA and stay below. The price action travel along with 200 MA and finally, the price action stay below 200 MA. The 200 MA begin with slopping up, next travel in horizon level, then slopping down. Trade with your eyes open.
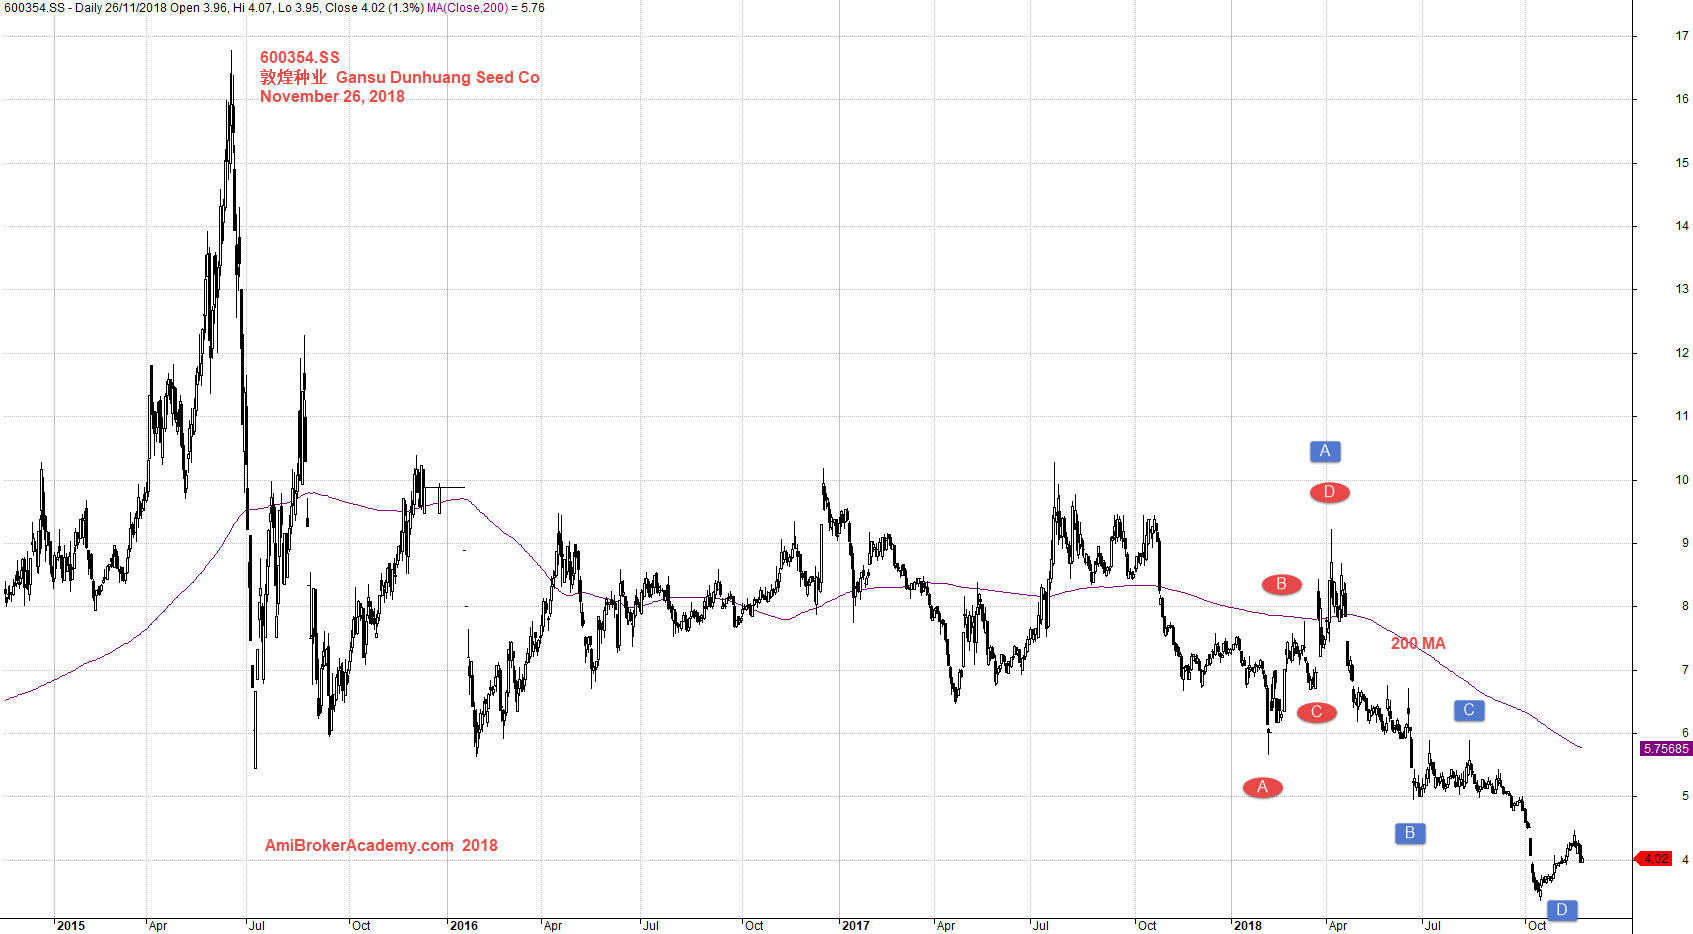
November 26, 2018 敦煌种业 Gansu Dunhuang Seed Co and 200 MA
Add the 34 period moving average, using the high, low and close of 34 moving averages. The visual aid can help you to determine the trade direction; you could buy when the price action above river, and sell when the price action below river. Manage your risk.
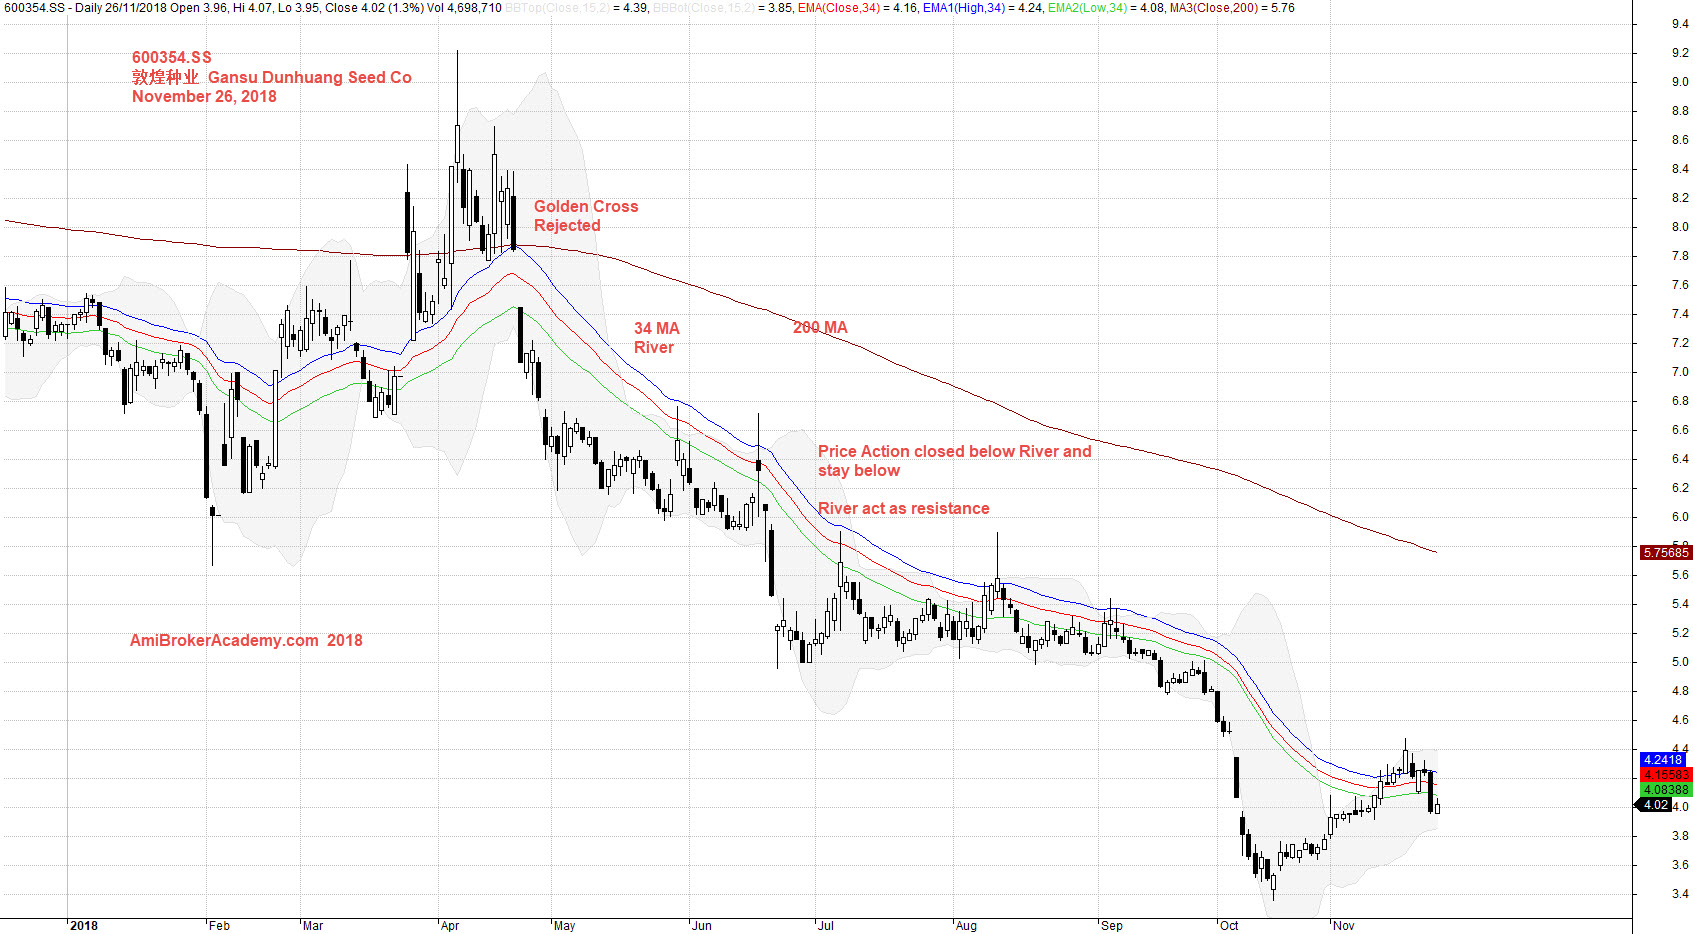
November 26, 2018 敦煌种业 Gansu Dunhuang Seed Co and River
Moses
AmiBrokerAcademy.com
Disclaimer
The above result is for illustration purpose. It is not meant to be used for buy or sell decision. We do not recommend any particular stocks. If particular stocks of such are mentioned, they are meant as demonstration of Amibroker as a powerful charting software and MACD. Amibroker can program to scan the stocks for buy and sell signals.
These are script generated signals. Not all scan results are shown here. The MACD signal should use with price action. Users must understand what MACD and price action are all about before using them. If necessary you should attend a course to learn more on Technical Analysis (TA) and Moving Average Convergence Divergence, MACD.
Once again, the website does not guarantee any results or investment return based on the information and instruction you have read here. It should be used as learning aids only and if you decide to trade real money, all trading decision should be your own.