1 December 2018
Thanks for visiting the site.
Shanghai Stock Analysis
000001.SS Shanghai Stock Exchange Composite Index Stock Charting
Trade with your eyes open. Manage your trade.
Support Resistance is the an important tool in technical analysis. But, MACD indicator too, a good indicator. See chart, we see +ve divergence. See chart, may be SSEC might be in the process of reversing.
H M Gartley 222 pattern provides you the clue on when the price action might be changing direction. See chart, you could identify many nice ABCD pattern.
See chart, trade with your eyes open.
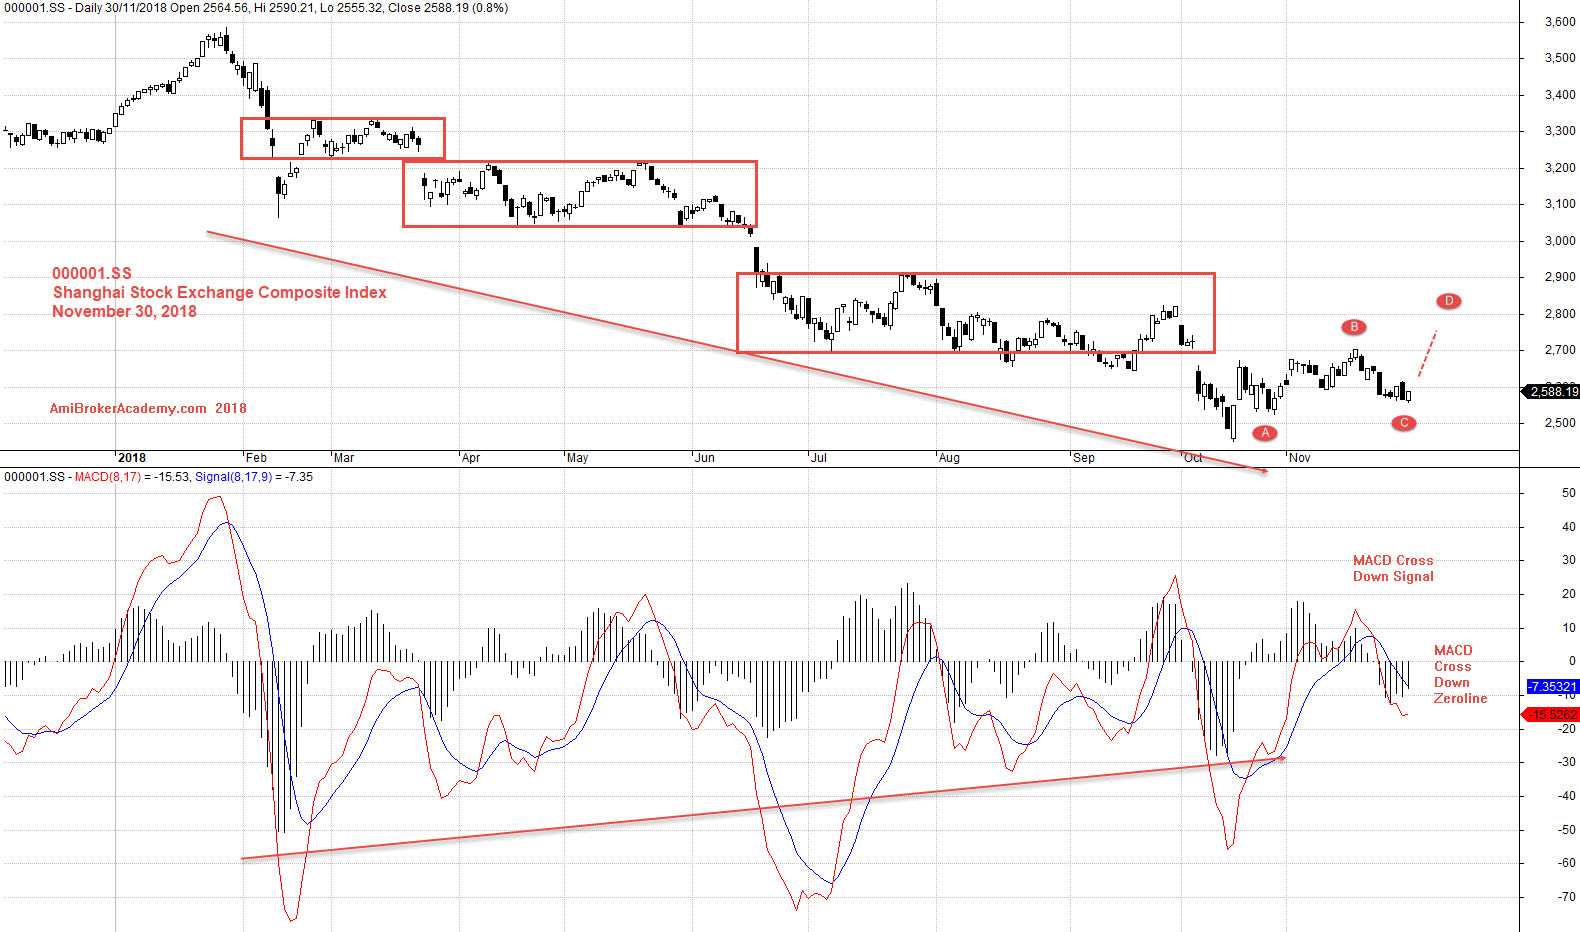
November 30, 2018 Shanghai Stock Exchange Composited Index and MACD
Moses
AmiBrokerAcademy.com
Disclaimer
The above result is for illustration purpose. It is not meant to be used for buy or sell decision. We do not recommend any particular stocks. If particular stocks of such are mentioned, they are meant as demonstration of Amibroker as a powerful charting software and MACD. Amibroker can program to scan the stocks for buy and sell signals.
These are script generated signals. Not all scan results are shown here. The MACD signal should use with price action. Users must understand what MACD and price action are all about before using them. If necessary you should attend a course to learn more on Technical Analysis (TA) and Moving Average Convergence Divergence, MACD.
Once again, the website does not guarantee any results or investment return based on the information and instruction you have read here. It should be used as learning aids only and if you decide to trade real money, all trading decision should be your own.