June 2, 2018
Thanks for visiting the site.
Shanghai Stock Analysis
中远航特 COSCO Shipping Specialized Carriers Co Charting
See chart, the price action of 中远航特 COSCO Shipping Specialized Carriers Co. We try using Darva Box theory. Manage your risk.
Darvas Box Theory is a trading strategy that was developed back in 1956 by a former ballroom dancer Nicolas Darvas. Darvas’ trading technique involves buying into stocks that are trading at new highs. Besides that he has also written a book, How I Made $2,000,000 in the Stock Market.
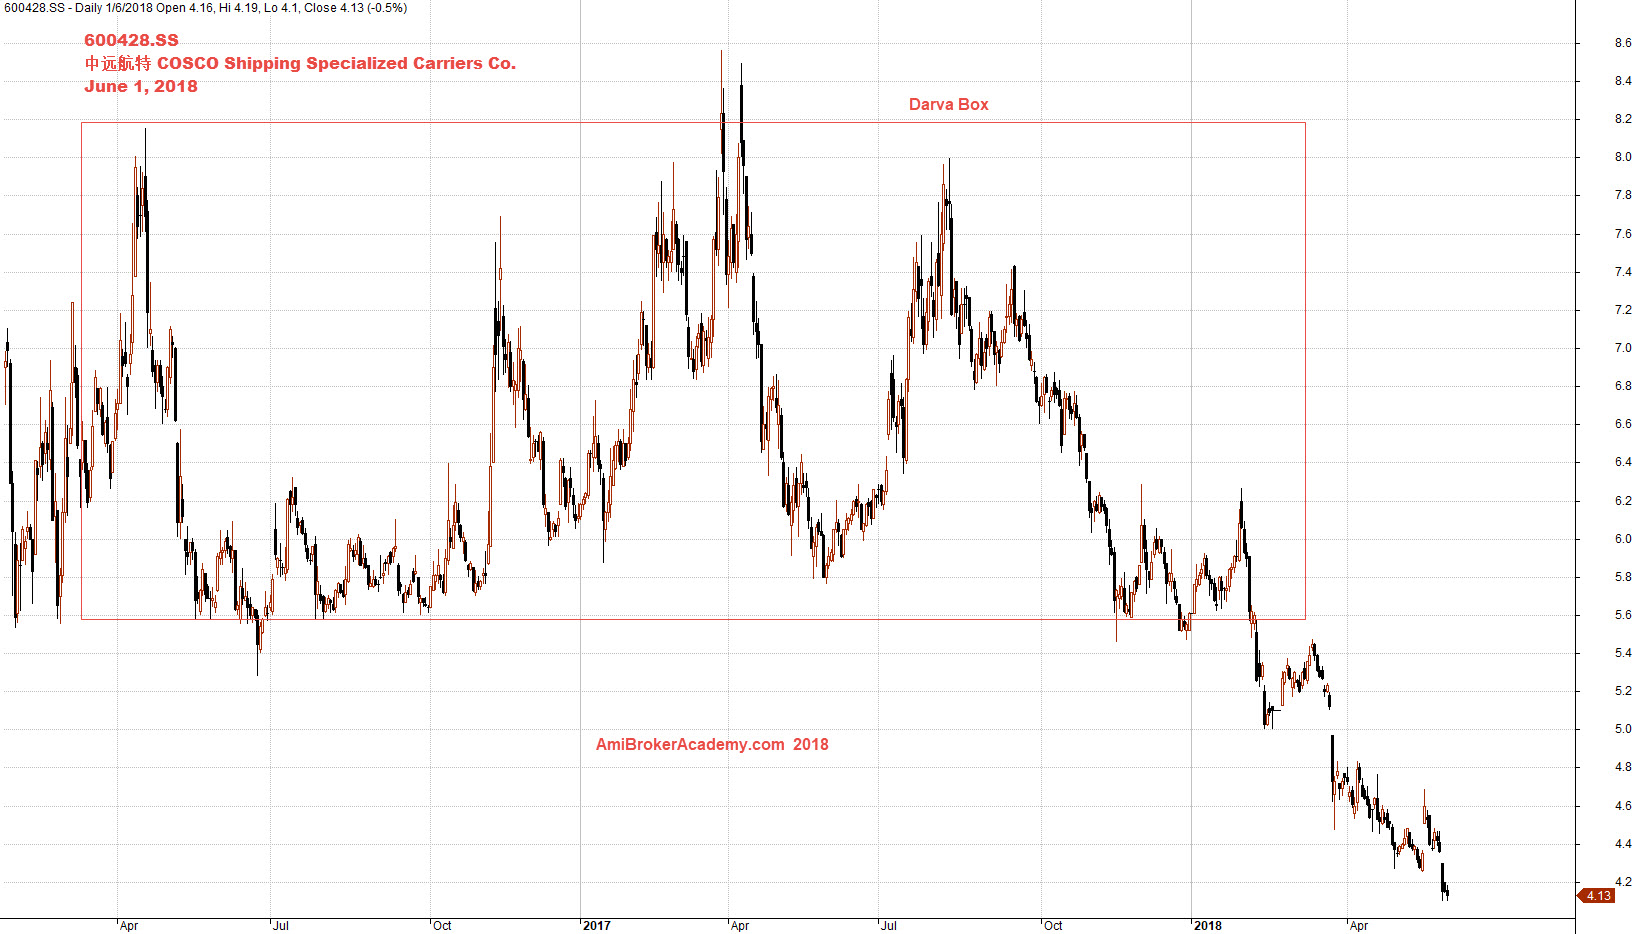
June 1, 2018 中远航特 COSCO Shipping Specialized Carriers Co and Darva Box
Powerful Chart Software – AmiBroker
The following chart is produced using AmiBroker charting software. It is a powerful chart software. You plot the stocks you are interested all in one chart, as long as you still could read them. See chart below.
中远航特 COSCO Shipping Specialized Carriers Co Charting and MA Wave
Picture worth a thousand words, see chart price action first cross up MA, and price action bounce above MA. Next the MA supported by MA, but soon fail and close below MA. Then the price action moves sideways. The price action resisted by MA, and stay below MA. … The price action continue to stay below MA. The price action is bearish.
Trade with your eyes open.
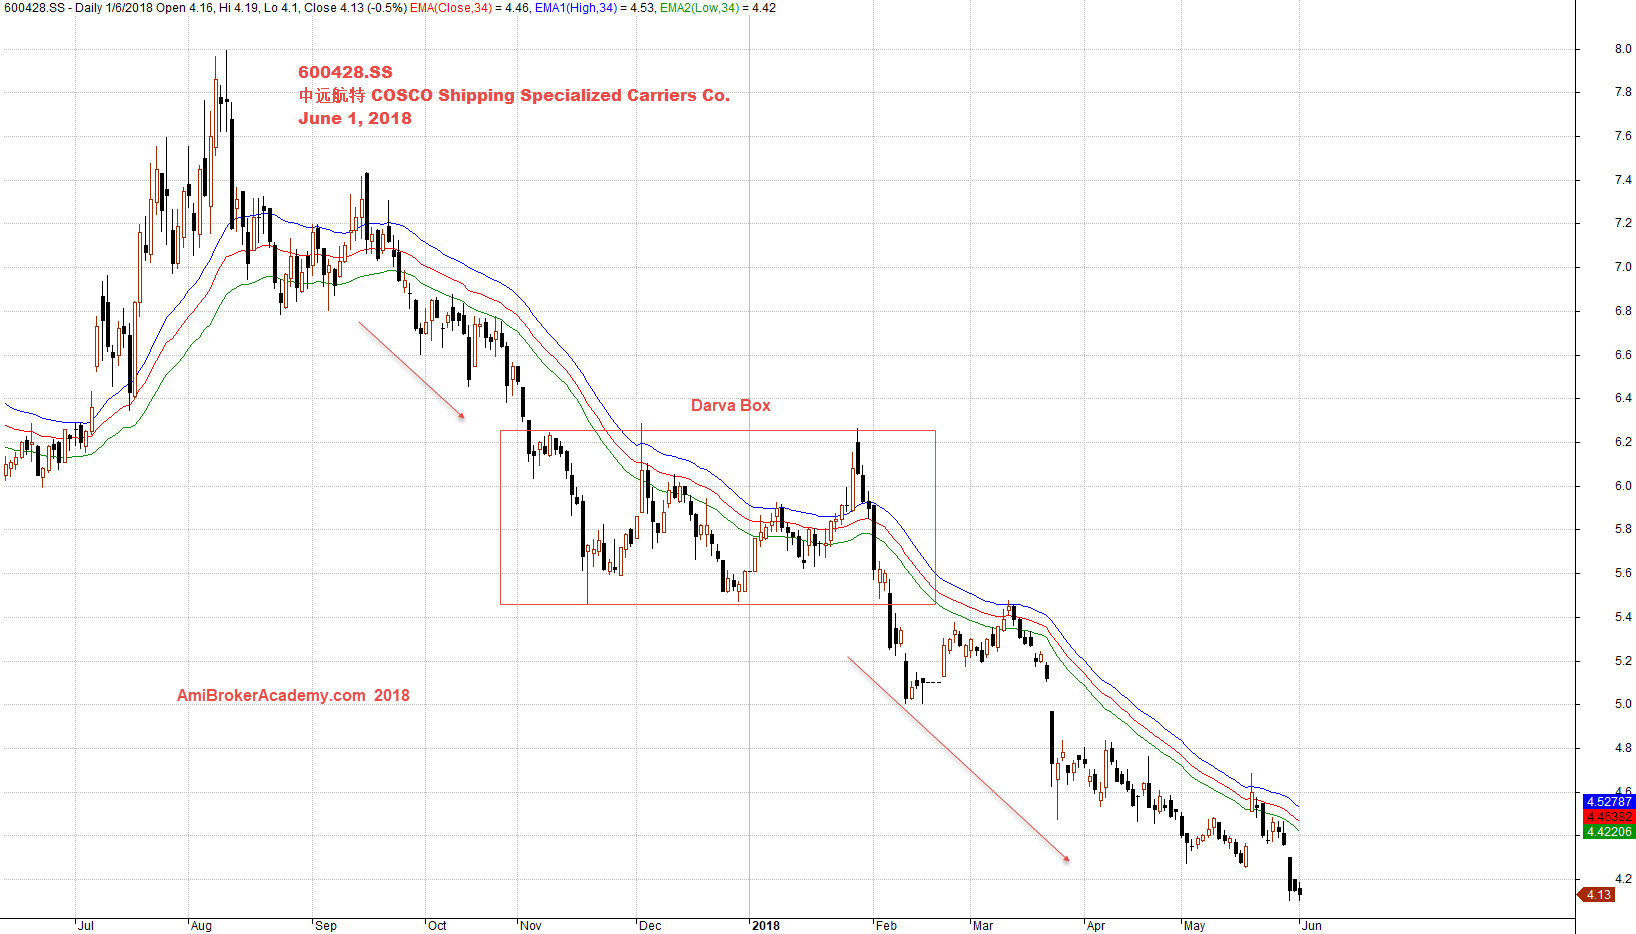
June 1, 2018 中远航特 COSCO Shipping Specialized Carriers Co and MA Wave
中远航特 COSCO Shipping Specialized Carriers Co Charting and MACD Divergence
Use MACD indicator, MACD indicator is a great tool for trend. See chart, picture worth a thousand words. Trend ending? Will see.
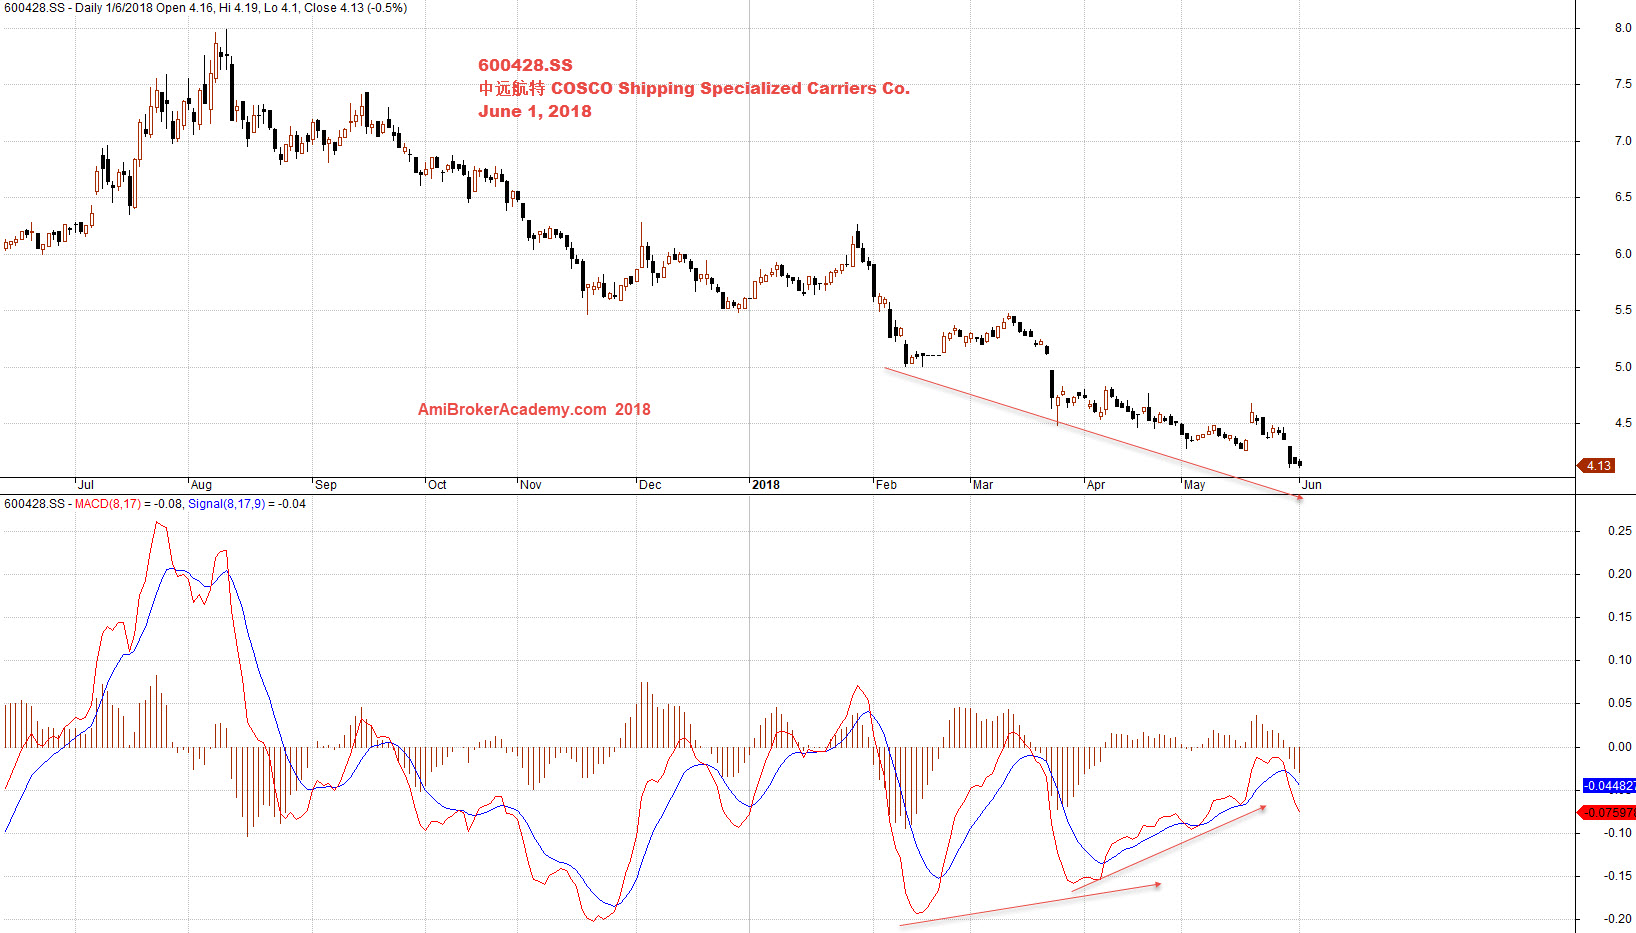
June 1, 2018 中远航特 COSCO Shipping Specialized Carriers Co and MACD Divergence
Moses
AmiBrokerAcademy.com
Disclaimer
The above result is for illustration purpose. It is not meant to be used for buy or sell decision. We do not recommend any particular stocks. If particular stocks of such are mentioned, they are meant as demonstration of Amibroker as a powerful charting software and MACD. Amibroker can program to scan the stocks for buy and sell signals.
These are script generated signals. Not all scan results are shown here. The MACD signal should use with price action. Users must understand what MACD and price action are all about before using them. If necessary you should attend a course to learn more on Technical Analysis (TA) and Moving Average Convergence Divergence, MACD.
Once again, the website does not guarantee any results or investment return based on the information and instruction you have read here. It should be used as learning aids only and if you decide to trade real money, all trading decision should be your own.