September 14, 2018
Thanks for visiting the site.
Free U.S. Stock MACD Scan
What is MACD?
MACD stands for Moving Average Convergence Divergence, common setting is (12,26,9)
MACD indicator is a trend trading system that makes up of 2 lines. The MACD Line (fast line) and MACD Signal Line (slow line).
1) When the MACD Line crosses over the MACD Signal Line the trend is bullish. When the MACD Line crosses below the MACD Signal the trend is bearish.
2) When the MACD Line crosses above zero line the trend is bullish. When the MACD line crosses below zero line the trend is bearish.
MACD Signal Example – Mastercard
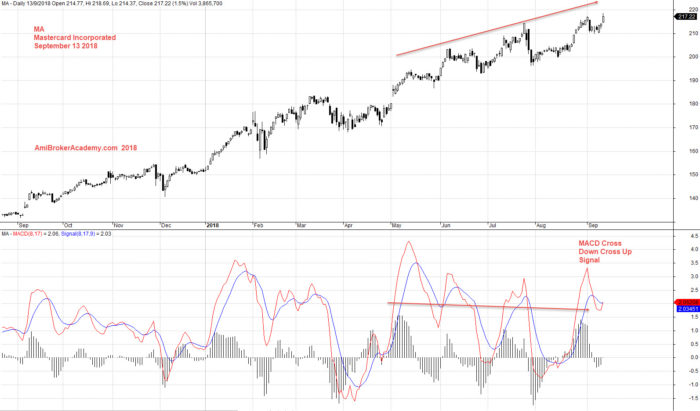
September 13, 2018 Mastercard Incorporated and MACD
September 13 2018 – Script Generated One-day U.S. Stock MACD Signals
The following are script generated One-day U.S. Stock Market MACD signals using the Powerful AmiBroker’s AFL.
The MACD Setting used is (8,17,9)
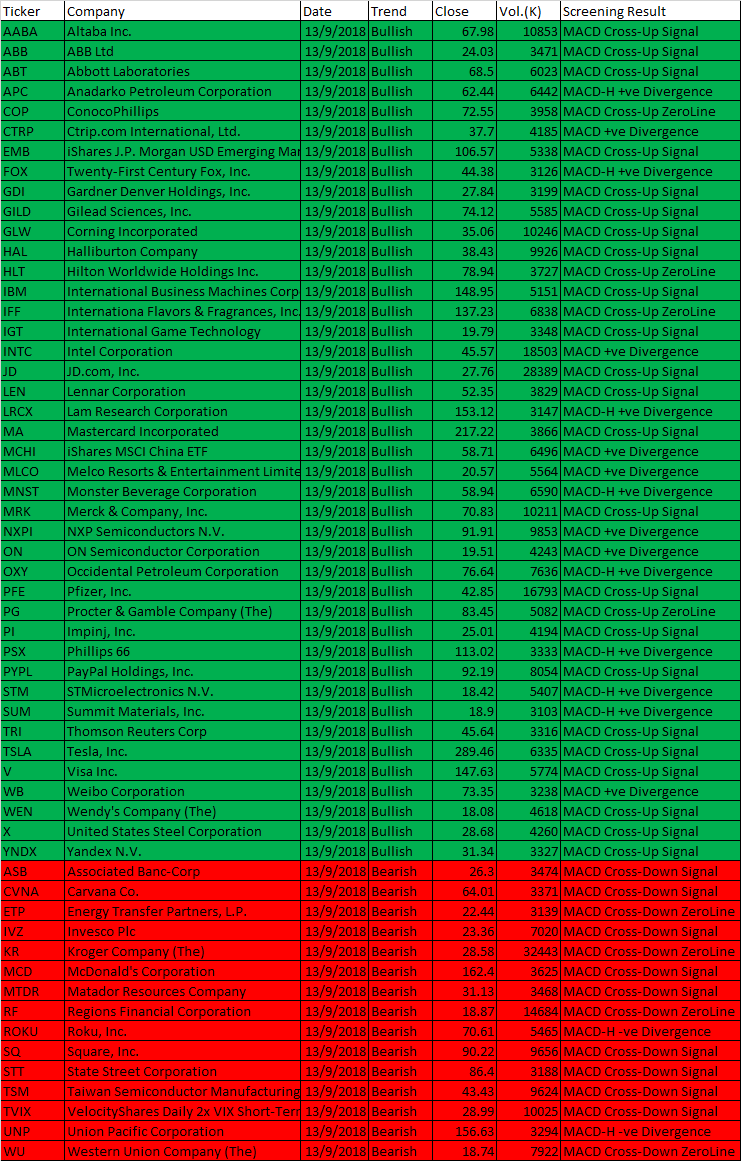
September 13, 2018 US Stock One-day MACD Trend
| Ticker | Company | Date | Trend | Close | Vol.(K) | Screening Result |
| AABA | Altaba Inc. | 13/9/2018 | Bullish | 67.98 | 10853 | MACD Cross-Up Signal |
| ABB | ABB Ltd | 13/9/2018 | Bullish | 24.03 | 3471 | MACD Cross-Up Signal |
| ABT | Abbott Laboratories | 13/9/2018 | Bullish | 68.5 | 6023 | MACD Cross-Up Signal |
| APC | Anadarko Petroleum Corporation | 13/9/2018 | Bullish | 62.44 | 6442 | MACD-H +ve Divergence |
| COP | ConocoPhillips | 13/9/2018 | Bullish | 72.55 | 3958 | MACD Cross-Up ZeroLine |
| CTRP | Ctrip.com International, Ltd. | 13/9/2018 | Bullish | 37.7 | 4185 | MACD +ve Divergence |
| EMB | iShares J.P. Morgan USD Emerging Markets Bond ETF | 13/9/2018 | Bullish | 106.57 | 5338 | MACD Cross-Up Signal |
| FOX | Twenty-First Century Fox, Inc. | 13/9/2018 | Bullish | 44.38 | 3126 | MACD-H +ve Divergence |
| GDI | Gardner Denver Holdings, Inc. | 13/9/2018 | Bullish | 27.84 | 3199 | MACD Cross-Up Signal |
| GILD | Gilead Sciences, Inc. | 13/9/2018 | Bullish | 74.12 | 5585 | MACD Cross-Up Signal |
| GLW | Corning Incorporated | 13/9/2018 | Bullish | 35.06 | 10246 | MACD Cross-Up Signal |
| HAL | Halliburton Company | 13/9/2018 | Bullish | 38.43 | 9926 | MACD Cross-Up Signal |
| HLT | Hilton Worldwide Holdings Inc. | 13/9/2018 | Bullish | 78.94 | 3727 | MACD Cross-Up ZeroLine |
| IBM | International Business Machines Corporation | 13/9/2018 | Bullish | 148.95 | 5151 | MACD Cross-Up Signal |
| IFF | Internationa Flavors & Fragrances, Inc. | 13/9/2018 | Bullish | 137.23 | 6838 | MACD Cross-Up ZeroLine |
| IGT | International Game Technology | 13/9/2018 | Bullish | 19.79 | 3348 | MACD Cross-Up Signal |
| INTC | Intel Corporation | 13/9/2018 | Bullish | 45.57 | 18503 | MACD +ve Divergence |
| JD | JD.com, Inc. | 13/9/2018 | Bullish | 27.76 | 28389 | MACD Cross-Up Signal |
| LEN | Lennar Corporation | 13/9/2018 | Bullish | 52.35 | 3829 | MACD Cross-Up Signal |
| LRCX | Lam Research Corporation | 13/9/2018 | Bullish | 153.12 | 3147 | MACD-H +ve Divergence |
| MA | Mastercard Incorporated | 13/9/2018 | Bullish | 217.22 | 3866 | MACD Cross-Up Signal |
| MCHI | iShares MSCI China ETF | 13/9/2018 | Bullish | 58.71 | 6496 | MACD +ve Divergence |
| MLCO | Melco Resorts & Entertainment Limited | 13/9/2018 | Bullish | 20.57 | 5564 | MACD +ve Divergence |
| MNST | Monster Beverage Corporation | 13/9/2018 | Bullish | 58.94 | 6590 | MACD-H +ve Divergence |
| MRK | Merck & Company, Inc. | 13/9/2018 | Bullish | 70.83 | 10211 | MACD Cross-Up Signal |
| NXPI | NXP Semiconductors N.V. | 13/9/2018 | Bullish | 91.91 | 9853 | MACD +ve Divergence |
| ON | ON Semiconductor Corporation | 13/9/2018 | Bullish | 19.51 | 4243 | MACD +ve Divergence |
| OXY | Occidental Petroleum Corporation | 13/9/2018 | Bullish | 76.64 | 7636 | MACD-H +ve Divergence |
| PFE | Pfizer, Inc. | 13/9/2018 | Bullish | 42.85 | 16793 | MACD Cross-Up Signal |
| PG | Procter & Gamble Company (The) | 13/9/2018 | Bullish | 83.45 | 5082 | MACD Cross-Up ZeroLine |
| PI | Impinj, Inc. | 13/9/2018 | Bullish | 25.01 | 4194 | MACD Cross-Up Signal |
| PSX | Phillips 66 | 13/9/2018 | Bullish | 113.02 | 3333 | MACD-H +ve Divergence |
| PYPL | PayPal Holdings, Inc. | 13/9/2018 | Bullish | 92.19 | 8054 | MACD Cross-Up Signal |
| STM | STMicroelectronics N.V. | 13/9/2018 | Bullish | 18.42 | 5407 | MACD-H +ve Divergence |
| SUM | Summit Materials, Inc. | 13/9/2018 | Bullish | 18.9 | 3103 | MACD-H +ve Divergence |
| TRI | Thomson Reuters Corp | 13/9/2018 | Bullish | 45.64 | 3316 | MACD Cross-Up Signal |
| TSLA | Tesla, Inc. | 13/9/2018 | Bullish | 289.46 | 6335 | MACD Cross-Up Signal |
| V | Visa Inc. | 13/9/2018 | Bullish | 147.63 | 5774 | MACD Cross-Up Signal |
| WB | Weibo Corporation | 13/9/2018 | Bullish | 73.35 | 3238 | MACD +ve Divergence |
| WEN | Wendy’s Company (The) | 13/9/2018 | Bullish | 18.08 | 4618 | MACD Cross-Up Signal |
| X | United States Steel Corporation | 13/9/2018 | Bullish | 28.68 | 4260 | MACD Cross-Up Signal |
| YNDX | Yandex N.V. | 13/9/2018 | Bullish | 31.34 | 3327 | MACD Cross-Up Signal |
| ASB | Associated Banc-Corp | 13/9/2018 | Bearish | 26.3 | 3474 | MACD Cross-Down Signal |
| CVNA | Carvana Co. | 13/9/2018 | Bearish | 64.01 | 3371 | MACD Cross-Down Signal |
| ETP | Energy Transfer Partners, L.P. | 13/9/2018 | Bearish | 22.44 | 3139 | MACD Cross-Down ZeroLine |
| IVZ | Invesco Plc | 13/9/2018 | Bearish | 23.36 | 7020 | MACD Cross-Down Signal |
| KR | Kroger Company (The) | 13/9/2018 | Bearish | 28.58 | 32443 | MACD Cross-Down ZeroLine |
| MCD | McDonald’s Corporation | 13/9/2018 | Bearish | 162.4 | 3625 | MACD Cross-Down Signal |
| MTDR | Matador Resources Company | 13/9/2018 | Bearish | 31.13 | 3468 | MACD Cross-Down Signal |
| RF | Regions Financial Corporation | 13/9/2018 | Bearish | 18.87 | 14684 | MACD Cross-Down ZeroLine |
| ROKU | Roku, Inc. | 13/9/2018 | Bearish | 70.61 | 5465 | MACD-H -ve Divergence |
| SQ | Square, Inc. | 13/9/2018 | Bearish | 90.22 | 9656 | MACD Cross-Down Signal |
| STT | State Street Corporation | 13/9/2018 | Bearish | 86.4 | 3188 | MACD Cross-Down Signal |
| TSM | Taiwan Semiconductor Manufacturing Company Ltd. | 13/9/2018 | Bearish | 43.43 | 9624 | MACD Cross-Down Signal |
| TVIX | VelocityShares Daily 2x VIX Short-Term ETN | 13/9/2018 | Bearish | 28.99 | 10025 | MACD Cross-Down Signal |
| UNP | Union Pacific Corporation | 13/9/2018 | Bearish | 156.63 | 3294 | MACD-H -ve Divergence |
| WU | Western Union Company (The) | 13/9/2018 | Bearish | 18.74 | 7922 | MACD Cross-Down ZeroLine |
Moses U.S. Stock MACD Scan
AmiBroker Academy.com
Disclaimer
The above result is for illustration purpose. It is not meant to be used for buy or sell decision. We do not recommend any particular stocks. If particular stocks of such are mentioned, they are meant as demonstration of Amibroker as a powerful charting software and MACD. Amibroker can program to scan the stocks for buy and sell signals.
These are script generated signals. Not all scan results are shown here. The MACD signal should use with price action. Users must understand what MACD and price action are all about before using them. If necessary you should attend a course to learn more on Technical Analysis (TA) and Moving Average Convergence Divergence, MACD.
Once again, the website does not guarantee any results or investment return based on the information and instruction you have read here. It should be used as learning aids only and if you decide to trade real money, all trading decision should be your own.