15 January 2021
Welcome!
Welcome to AmiBroker Academy dot com, amibrokeracademy.com. Thanks for your search and landed yourself here.
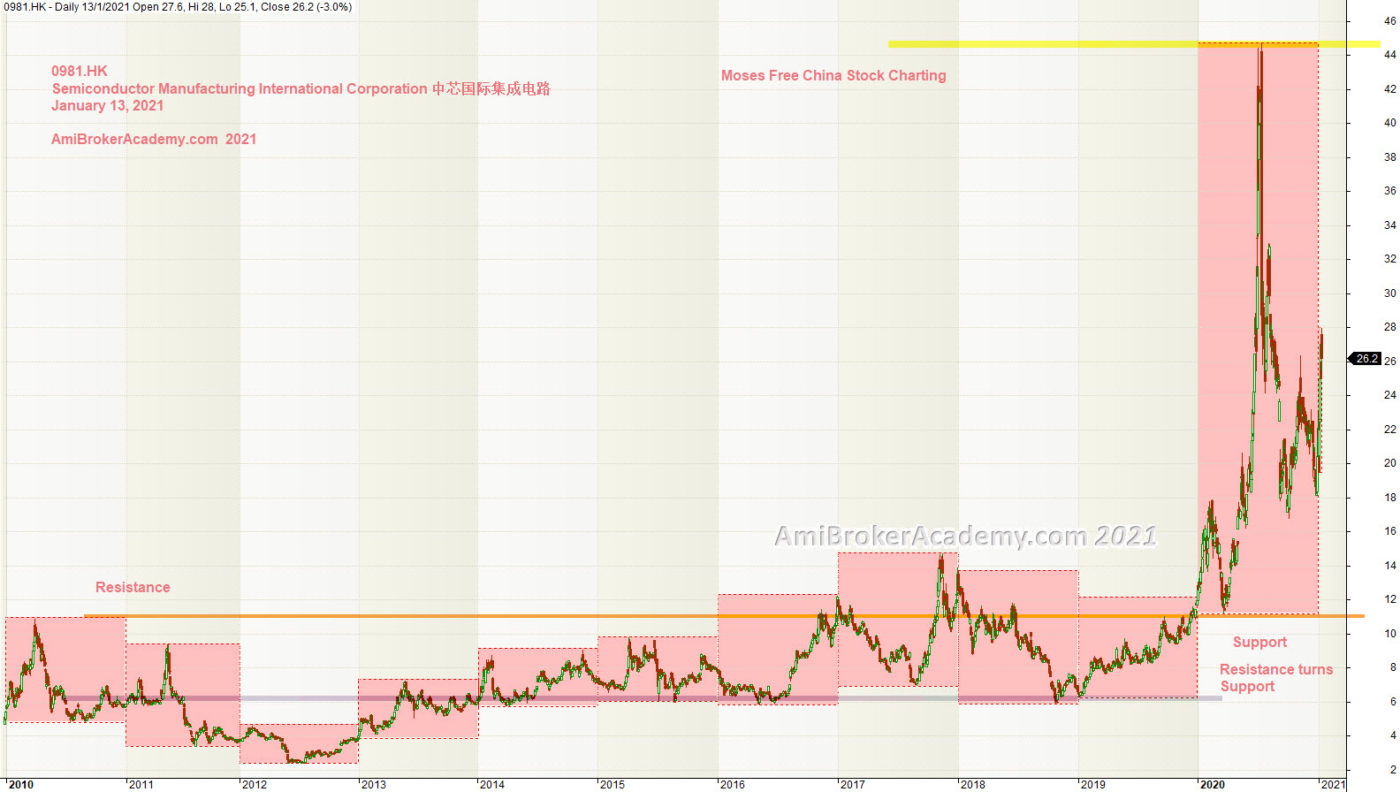
0981.HK | Semiconductor Manufacturing International Corporation | 中芯国际集成电路 and Box from 2010 Eleven Years Data
Picture worth a thousand words, see chart. Study Semiconductor Manufacturing International Corporation and Boxes from 2010.
Price Action like walking the staircase. 2020 has the biggest box, see chart.
From 2010 to 2019 the price action are like trapped within a zone, see chart.
Have fun!
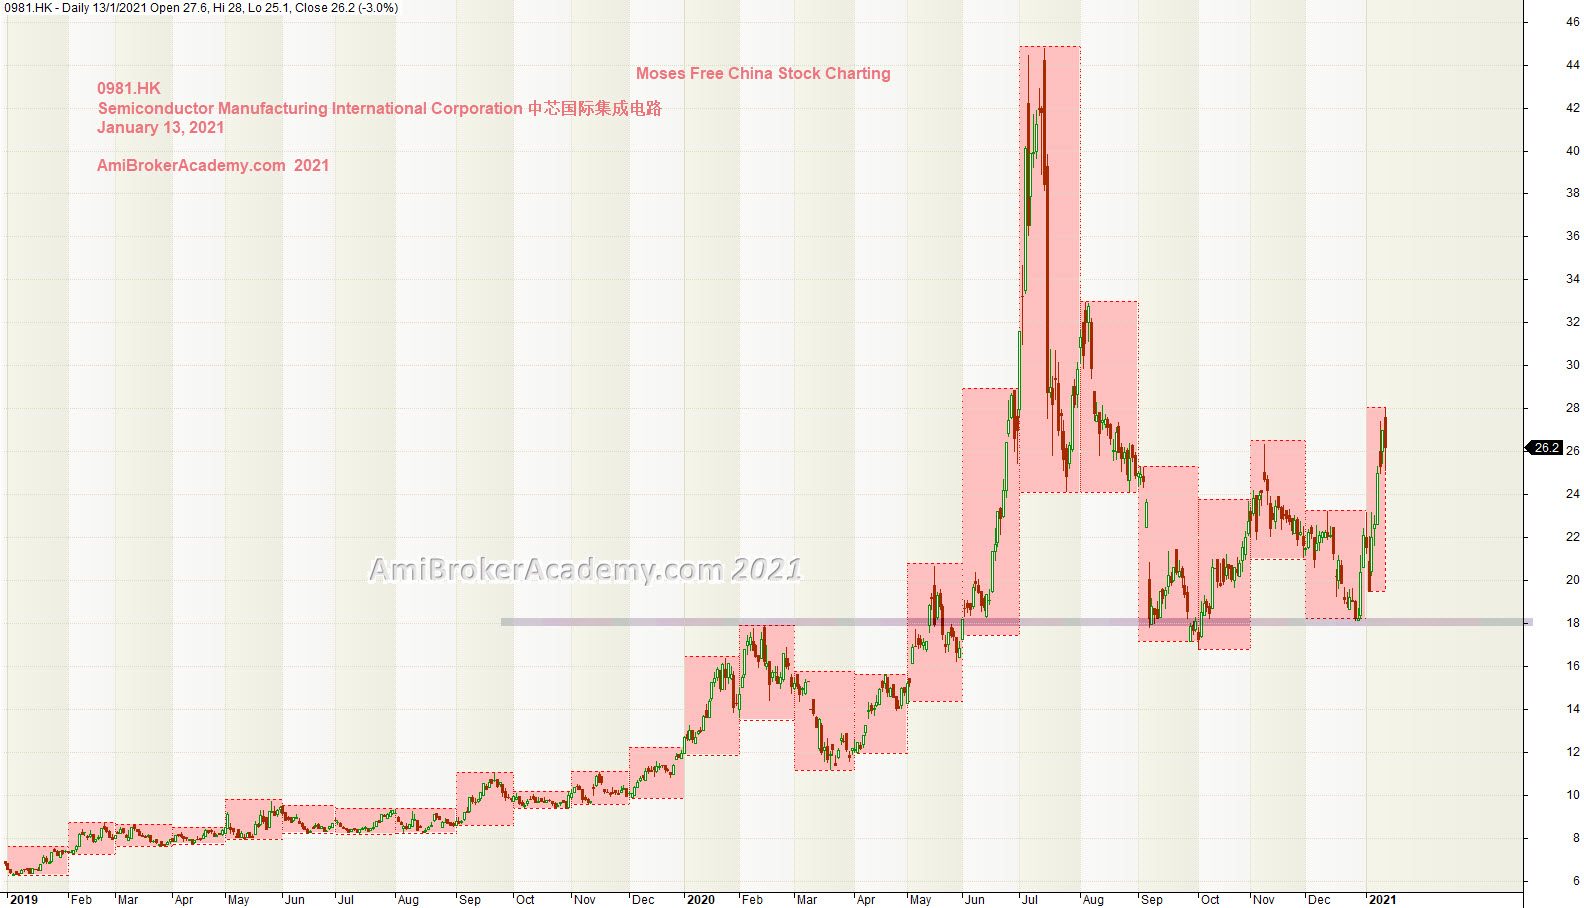
0981.HK | Semiconductor Manufacturing International Corporation | 中芯国际集成电路 and Box and Twenty Four Months Data
Study Semiconductor Manufacturing International Corporation and Boxes for Twenty Four Months Data.
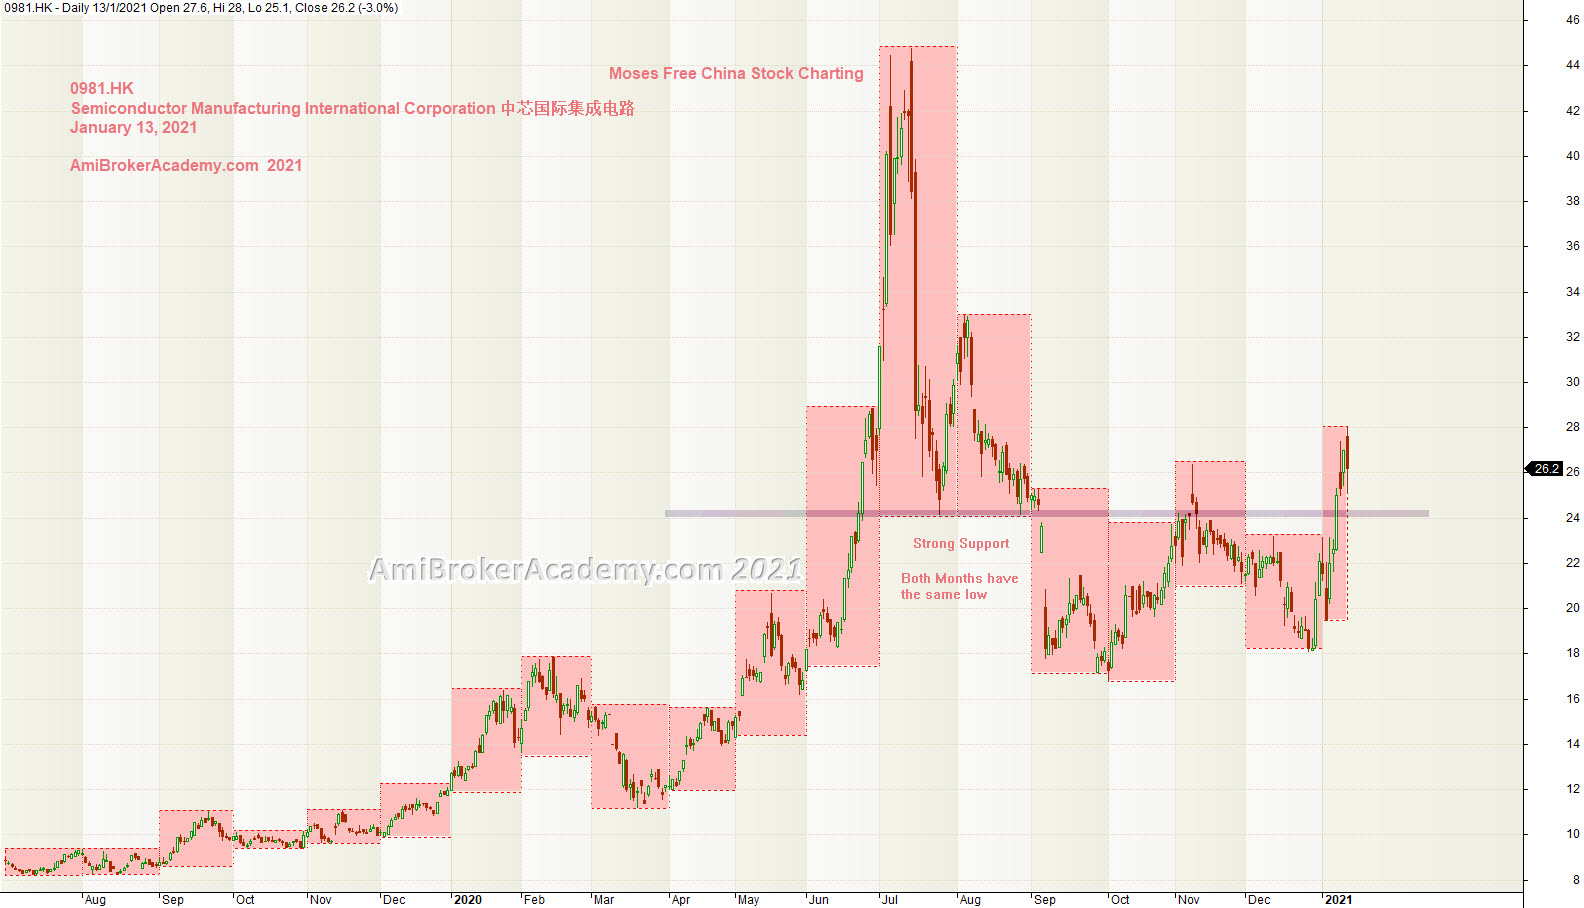
0981.HK | Semiconductor Manufacturing International Corporation 中芯国际集成电路 and Box for Eighteen Months Data
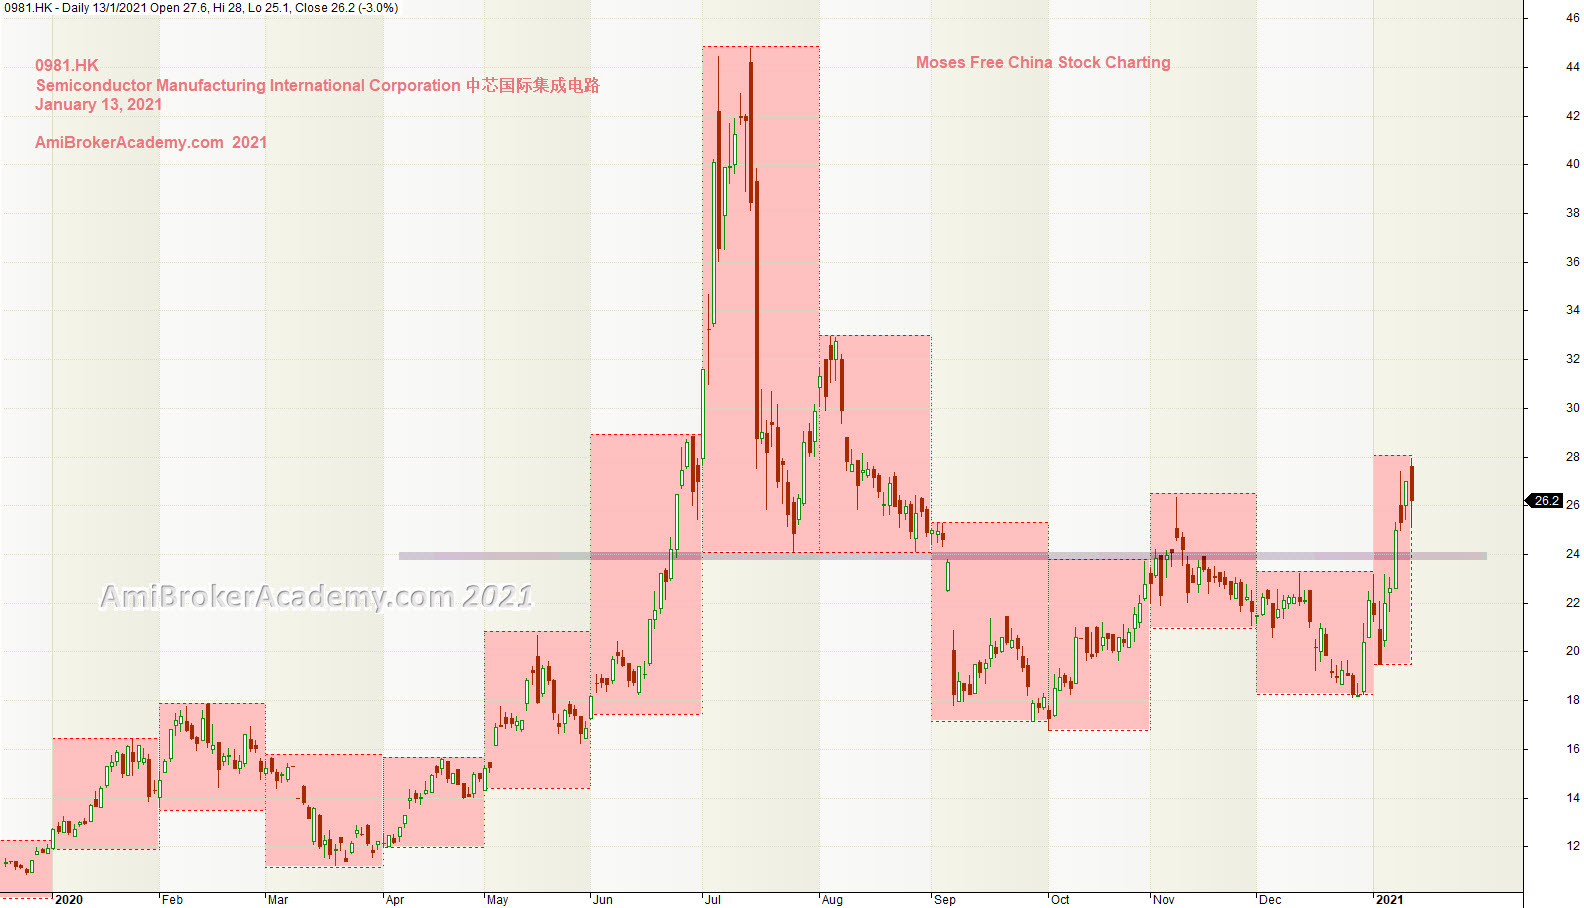
0981.HK | Semiconductor Manufacturing International Corporation 中芯国际集成电路 and Box for Twelve Months Data
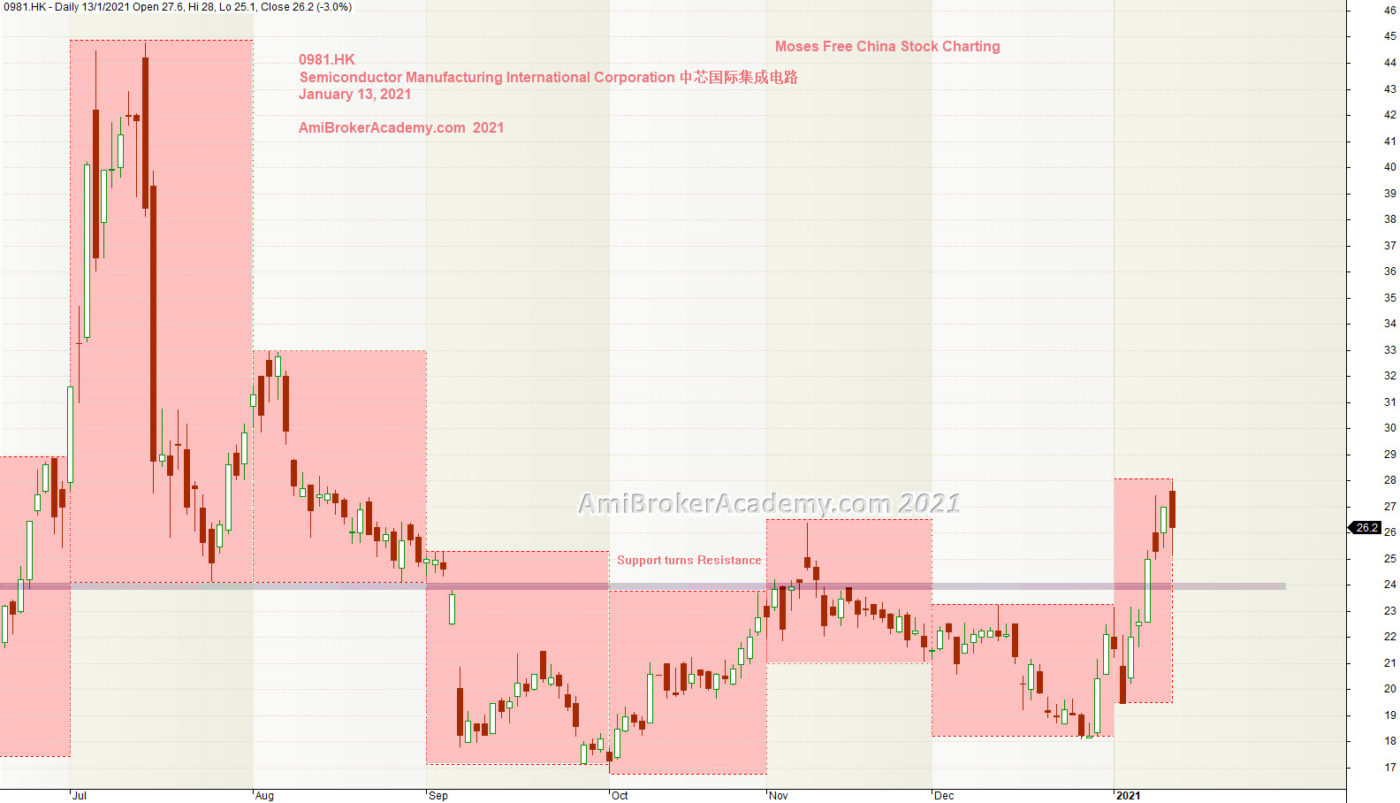
0981.HK | Semiconductor Manufacturing International Corporation 中芯国际集成电路 and Box for Six Months
Moses Free Stock Charting
Official AmiBrokerAcademy.com Charting
Disclaimer
The above result is for illustration purpose. It is not meant to be used for buy or sell decision. We do not recommend any particular stocks. If particular stocks of such are mentioned, they are meant as demonstration of Amibroker as a powerful charting software and MACD. Amibroker can program to scan the stocks for buy and sell signals.
These are script generated signals. Not all scan results are shown here. The MACD signal should use with price action. Users must understand what MACD and price action are all about before using them. If necessary you should attend a course to learn more on Technical Analysis (TA) and Moving Average Convergence Divergence, MACD.
Once again, the website does not guarantee any results or investment return based on the information and instruction you have read here. It should be used as learning aids only and if you decide to trade real money, all trading decision should be your own.
We learn from many past and present great traders. Kudo to these master.
顾左思右!
我们就是不一样的!
Look Left and Think Right
We are not an ordinary stock charting site. We are not the same.
We are different.
Have fun!
Side Notes:
You can copy our chart or charts for free, but you can’t copy our mind. Have fun! If you are reference to our chart or charts for whatever good use, please compliment us; indicate where the chart or charts from. We appreciate your kindness gesture. Many may find some of our chart or charts in some of the very interesting site, pxxx