January 17, 2018
Singapore Stock Analysis
Powerful Chart Software – AmiBroker
The following chart is produced using AmiBroker charting software. It is a powerful chart software. You plot the stocks you are interested all in one chart, as long as you still could read them. See chart below. Thereafter slowly climb up, step by step.
S63 Singapore Tech Engineering Year High Low
See chart. the boxes from left to right, it like the steps is stepping down, but step up on the last one. So, it means the trend was decline, bearish, and finally reverse up.
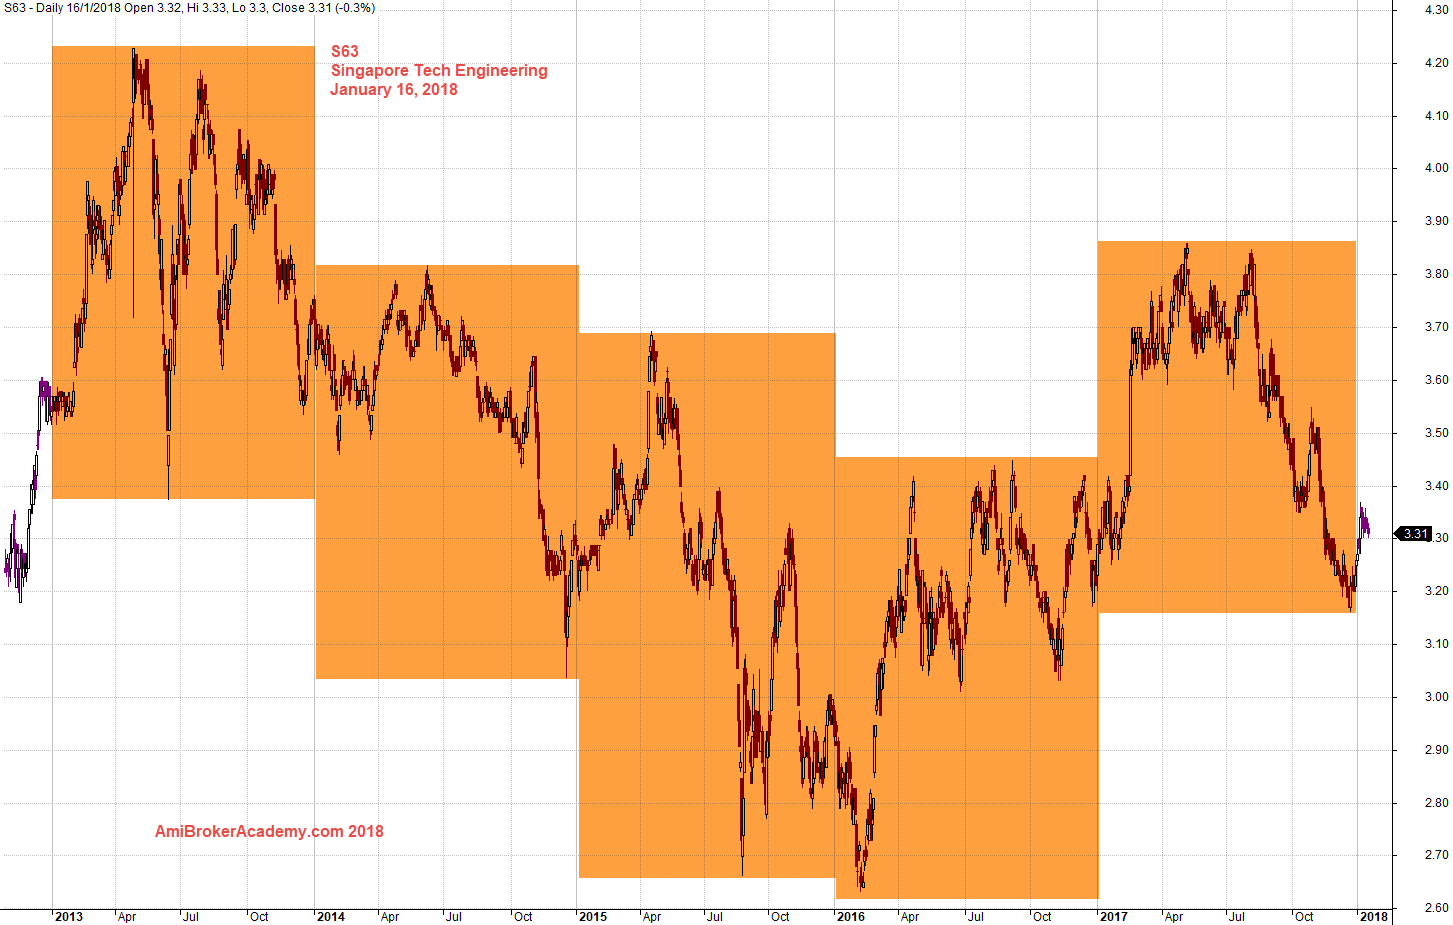
January 16, 2018 ST Tech Engineering Year High Low
S63 ST Tech Engineering and MACD
See MACD crossed below zeroline and stay below for sometime, finally the MACD cross up zeroline. Trend change? Will see.
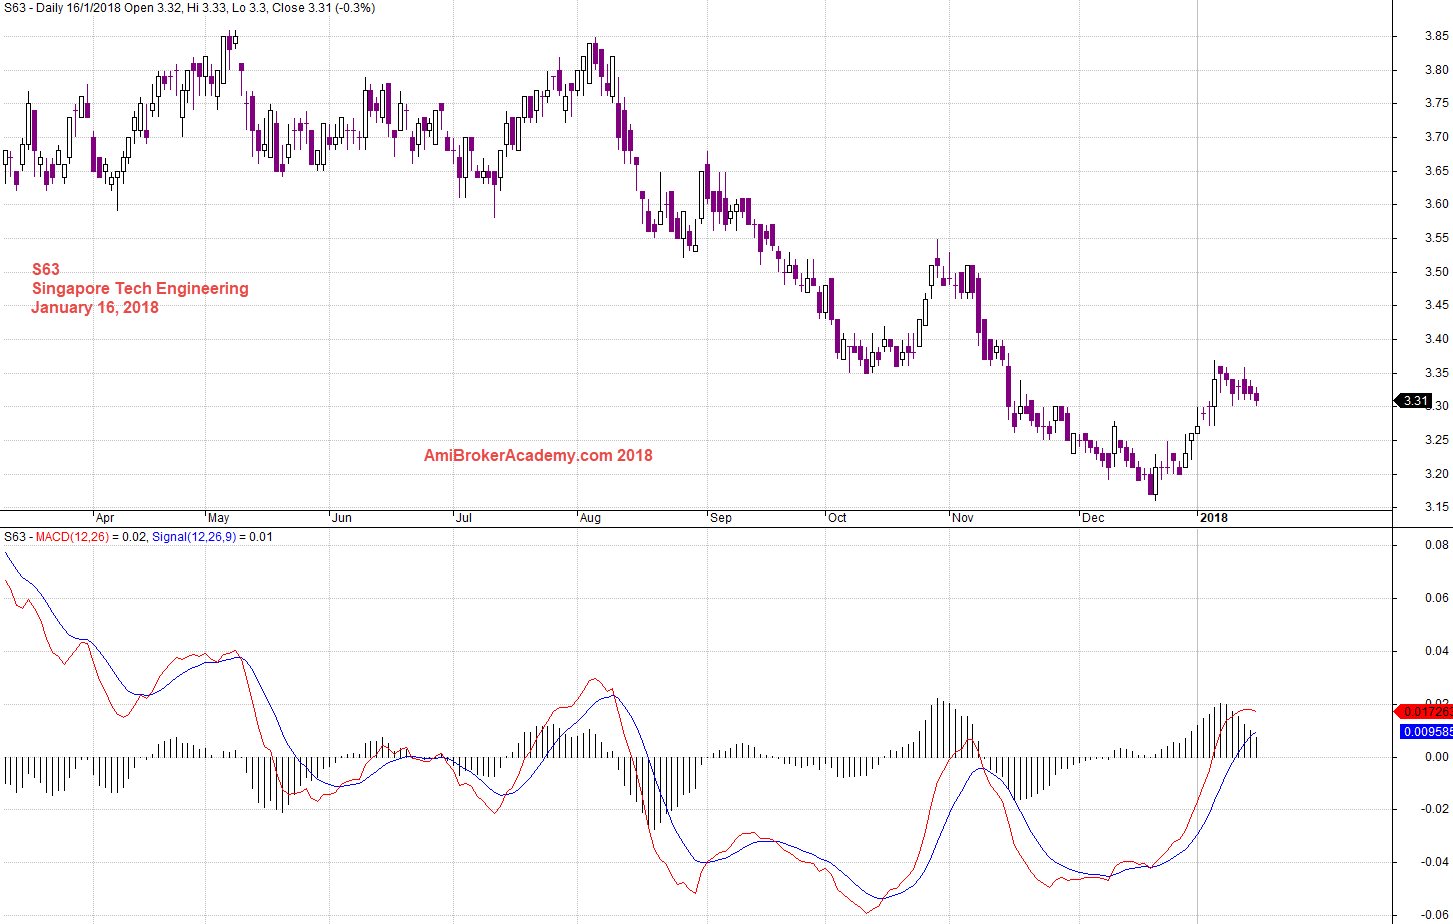
January 16, 2018 ST Tech Engineering and MACD
Moses
AmiBrokerAcademy.com
Disclaimer
The above result is for illustration purpose. It is not meant to be used for buy or sell decision. We do not recommend any particular stocks. If particular stocks of such are mentioned, they are meant as demonstration of Amibroker as a powerful charting software and MACD. Amibroker can program to scan the stocks for buy and sell signals.
These are script generated signals. Not all scan results are shown here. The MACD signal should use with price action. Users must understand what MACD and price action are all about before using them. If necessary you should attend a course to learn more on Technical Analysis (TA) and Moving Average Convergence Divergence, MACD.
Once again, the website does not guarantee any results or investment return based on the information and instruction you have read here. It should be used as learning aids only and if you decide to trade real money, all trading decision should be your own.