September 7, 2017
What is Russell 2000?
Russell 2000 Index is a small-cap stock market index of the bottom 2,000 stocks. Russell 2000 Index is opposite from S&P 500 index, as S&P 500 is used primarily for large capitalization stocks.
Russell 2000 index is by far the most common benchmark for mutual funds that identify themselves as “small-cap”.
^RUT Russell 2000 and ABCD Chart Pattern
See retracement levels, picture worth a thousand words. The Fibonacci level or Support Resistance levels are always have their effect. The price action respect them all.
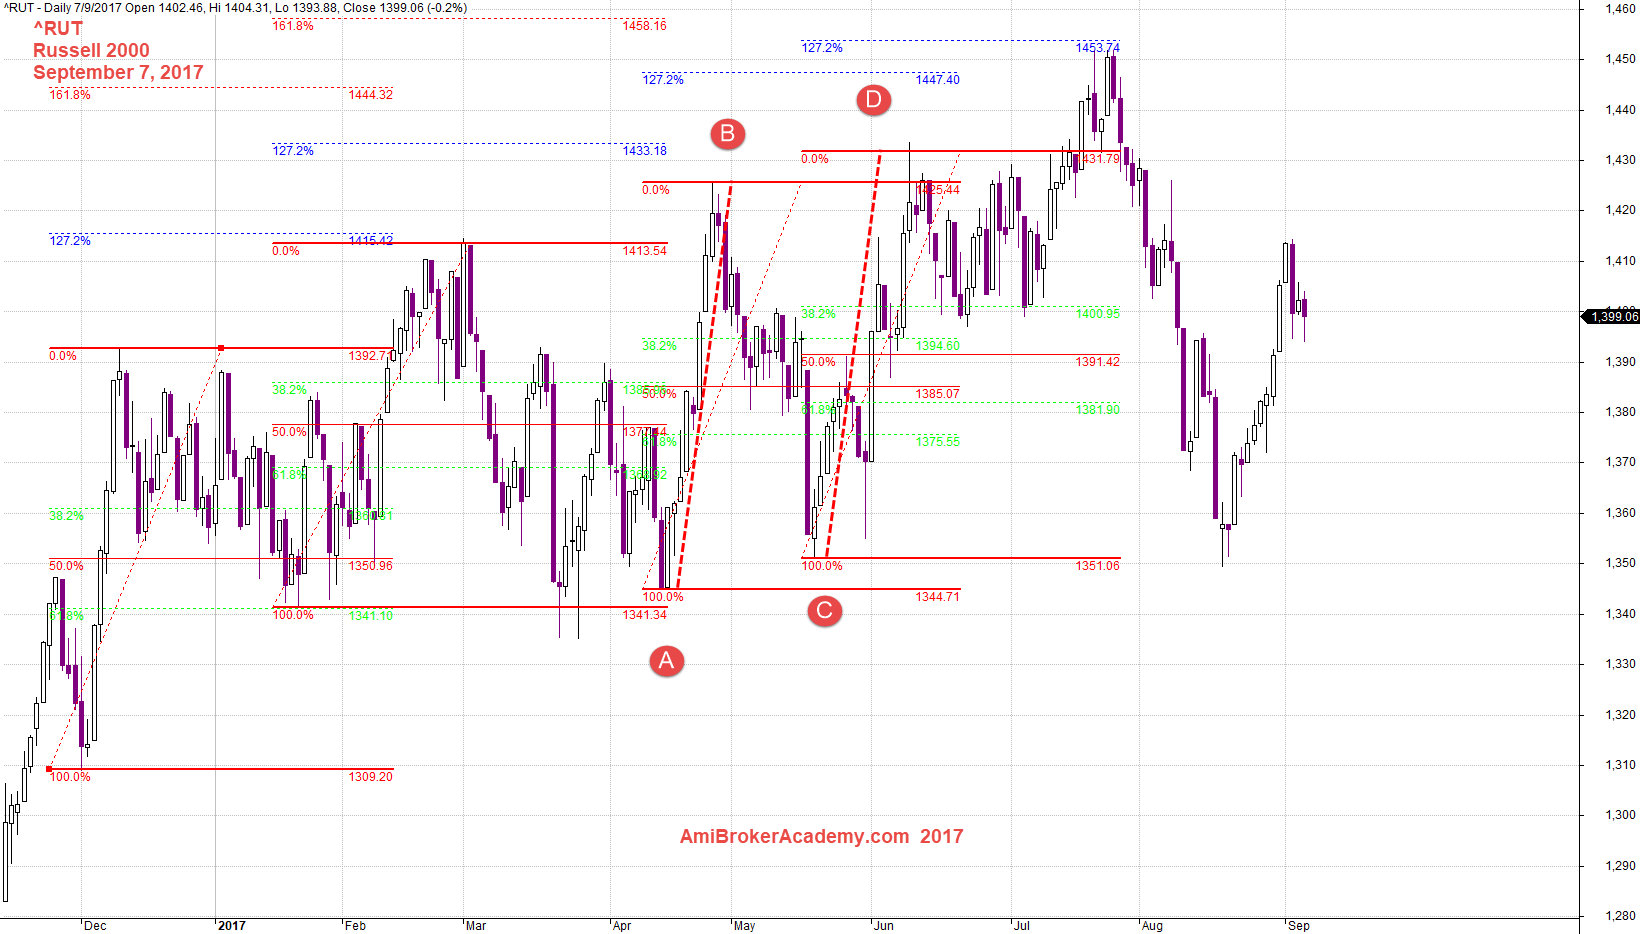
September 7, 2017 Russell 2000 and ABCD Chart Pattern
^RUT Russell 2000 and Channel
Picture worth a thousand words. See chart for more.
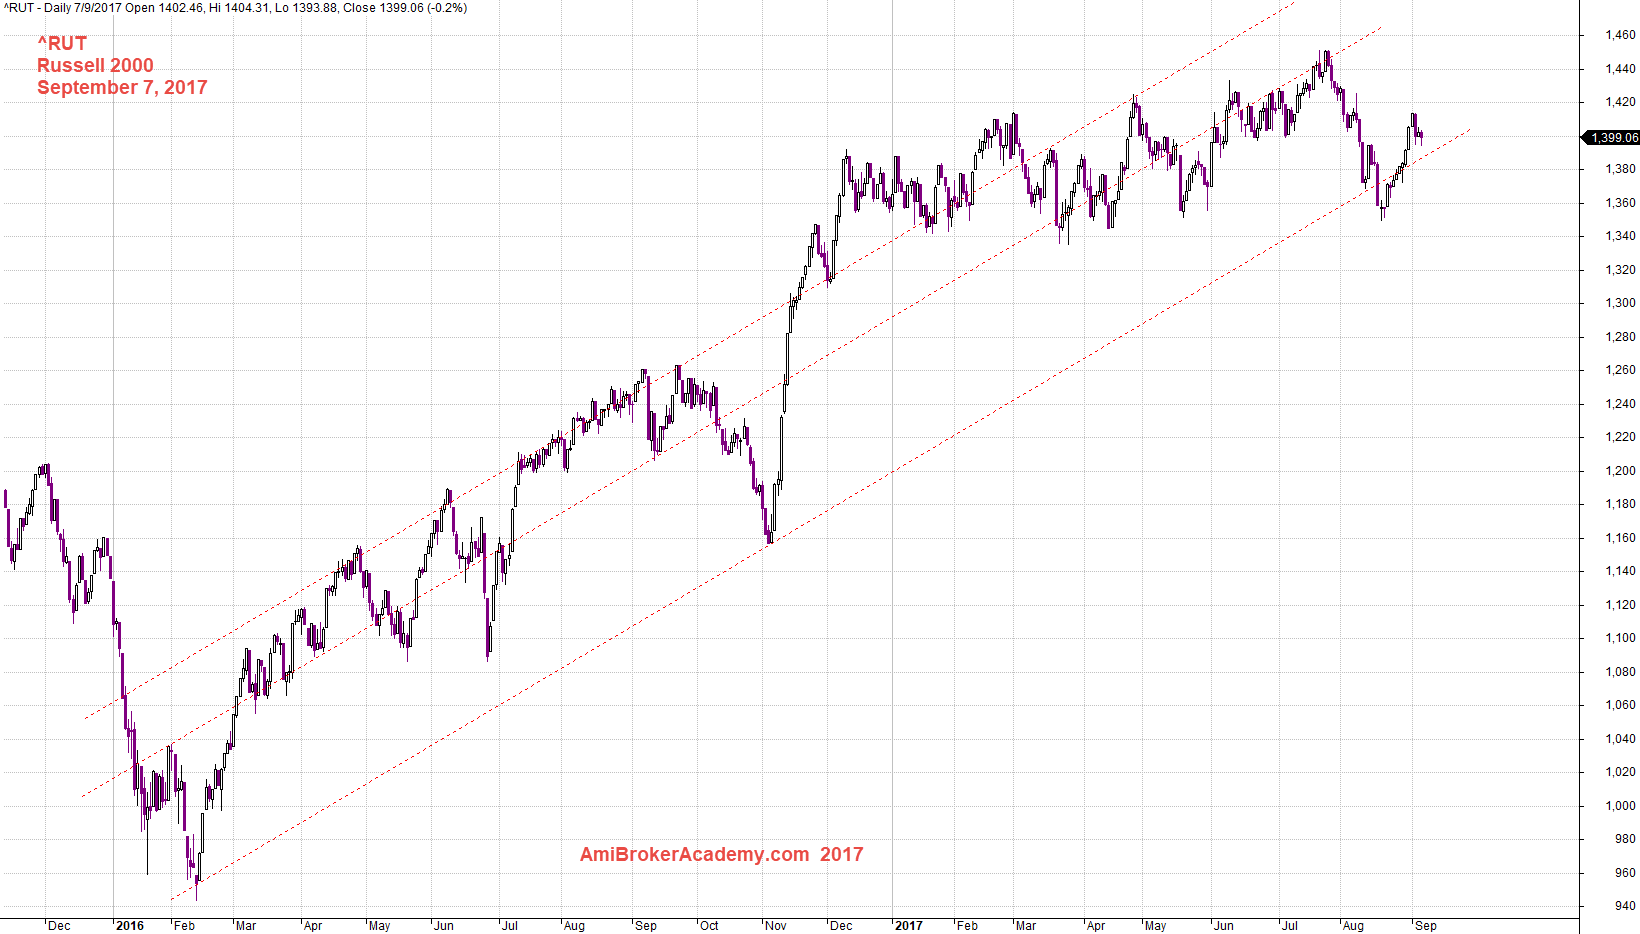
September 7, 2017 Russell 2000 and Channel
Thanks for visit the site here. You could also find free MACD scan here in this site too.
Moses
AmiBrokerAcademy.com
Disclaimer
The above result is for illustration purpose. It is not meant to be used for buy or sell decision. We do not recommend any particular stocks. If particular stocks of such are mentioned, they are meant as demonstration of Amibroker as a powerful charting software and MACD. Amibroker can program to scan the stocks for buy and sell signals.
These are script generated signals. Not all scan results are shown here. The MACD signal should use with price action. Users must understand what MACD and price action are all about before using them. If necessary you should attend a course to learn more on Technical Analysis (TA) and Moving Average Convergence Divergence, MACD.
Once again, the website does not guarantee any results or investment return based on the information and instruction you have read here. It should be used as learning aids only and if you decide to trade real money, all trading decision should be your own.