May 27, 2019
Welcome!
Welcome to AmiBrokerAcademy.com. Thanks for visiting the site.
Have fun!
INTC Intel Corporation Stock Charting
Study Intel Corporation stock chart and MACD.
See chart, picture worth a thousand words.
Price Action goes from the high to low and high again. See chart.
MACD-H goes lower, when price action continues to go higher. Positive MACD Divergence. MACD indicator signals there is a possible change in trend. See chart, price action drop down to test the same low below 44 dollars.
Trade with your eyes open.
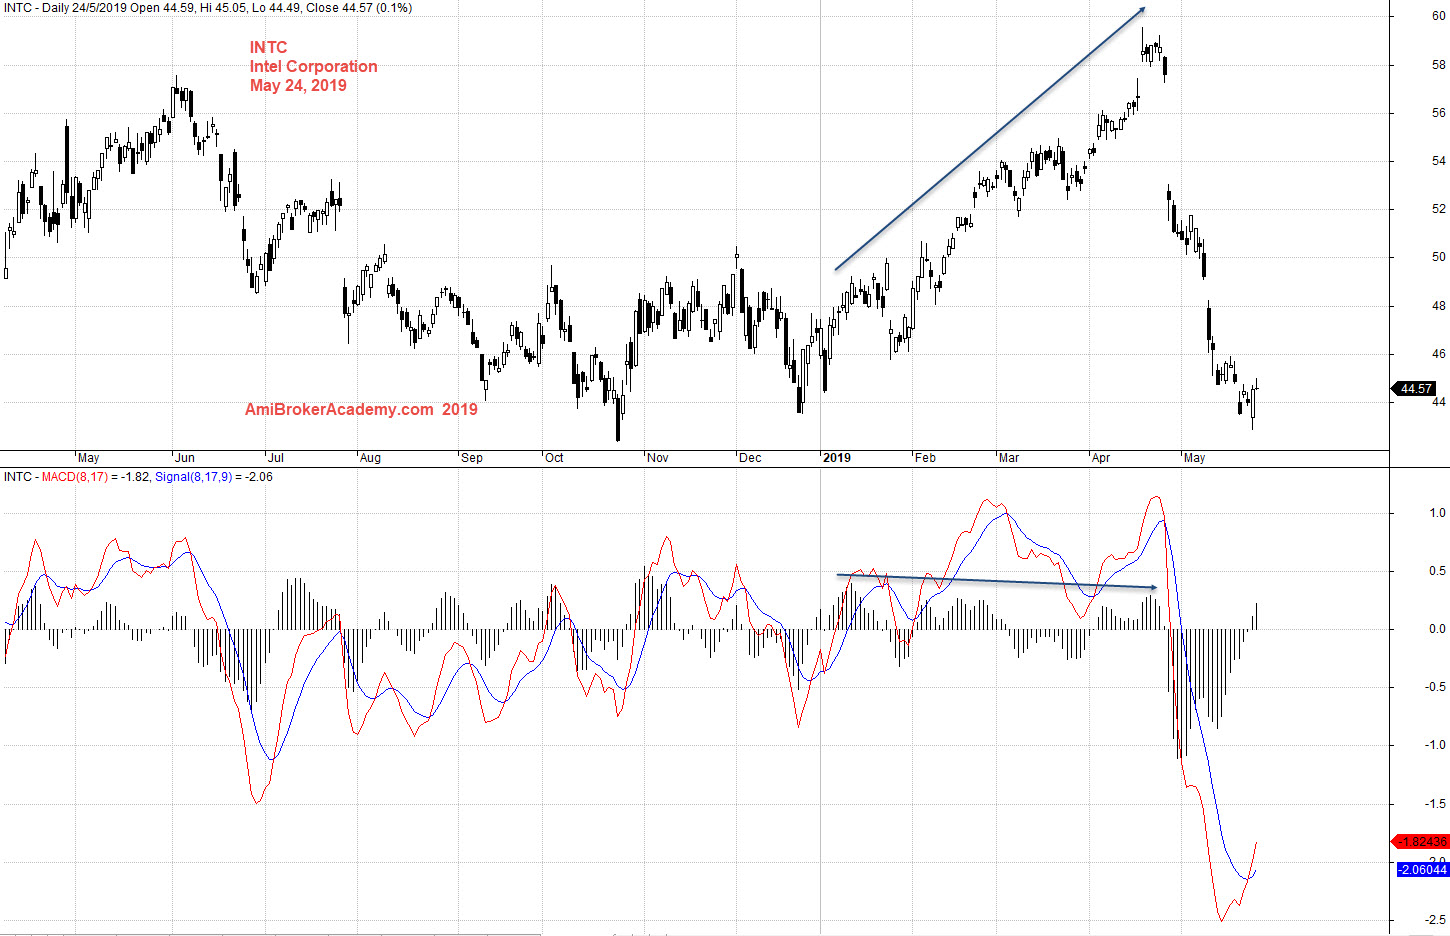
Many of example on our website are showing you the possible divergence trading.
MACD is one of the indicator gives you this kind of opportunity. See the example above. Now you see a positive MACD divergence. You should look for for a sell to take profit. Please do remember all setup can fail. So, trade with eyes open.
Moses Stock Observation
AmiBrokerAcademy.com
Disclaimer
The above result is for illustration purpose. It is not meant to be used for buy or sell decision. We do not recommend any particular stocks. If particular stocks of such are mentioned, they are meant as demonstration of Amibroker as a powerful charting software and MACD. Amibroker can program to scan the stocks for buy and sell signals.
These are script generated signals. Not all scan results are shown here. The MACD signal should use with price action. Users must understand what MACD and price action are all about before using them. If necessary you should attend a course to learn more on Technical Analysis (TA) and Moving Average Convergence Divergence, MACD.
Once again, the website does not guarantee any results or investment return based on the information and instruction you have read here. It should be used as learning aids only and if you decide to trade real money, all trading decision should be your own.