January 27, 2019
Welcome to AmiBrokerAcademy.com. We provide US stock analysis for academy learning.
Think!
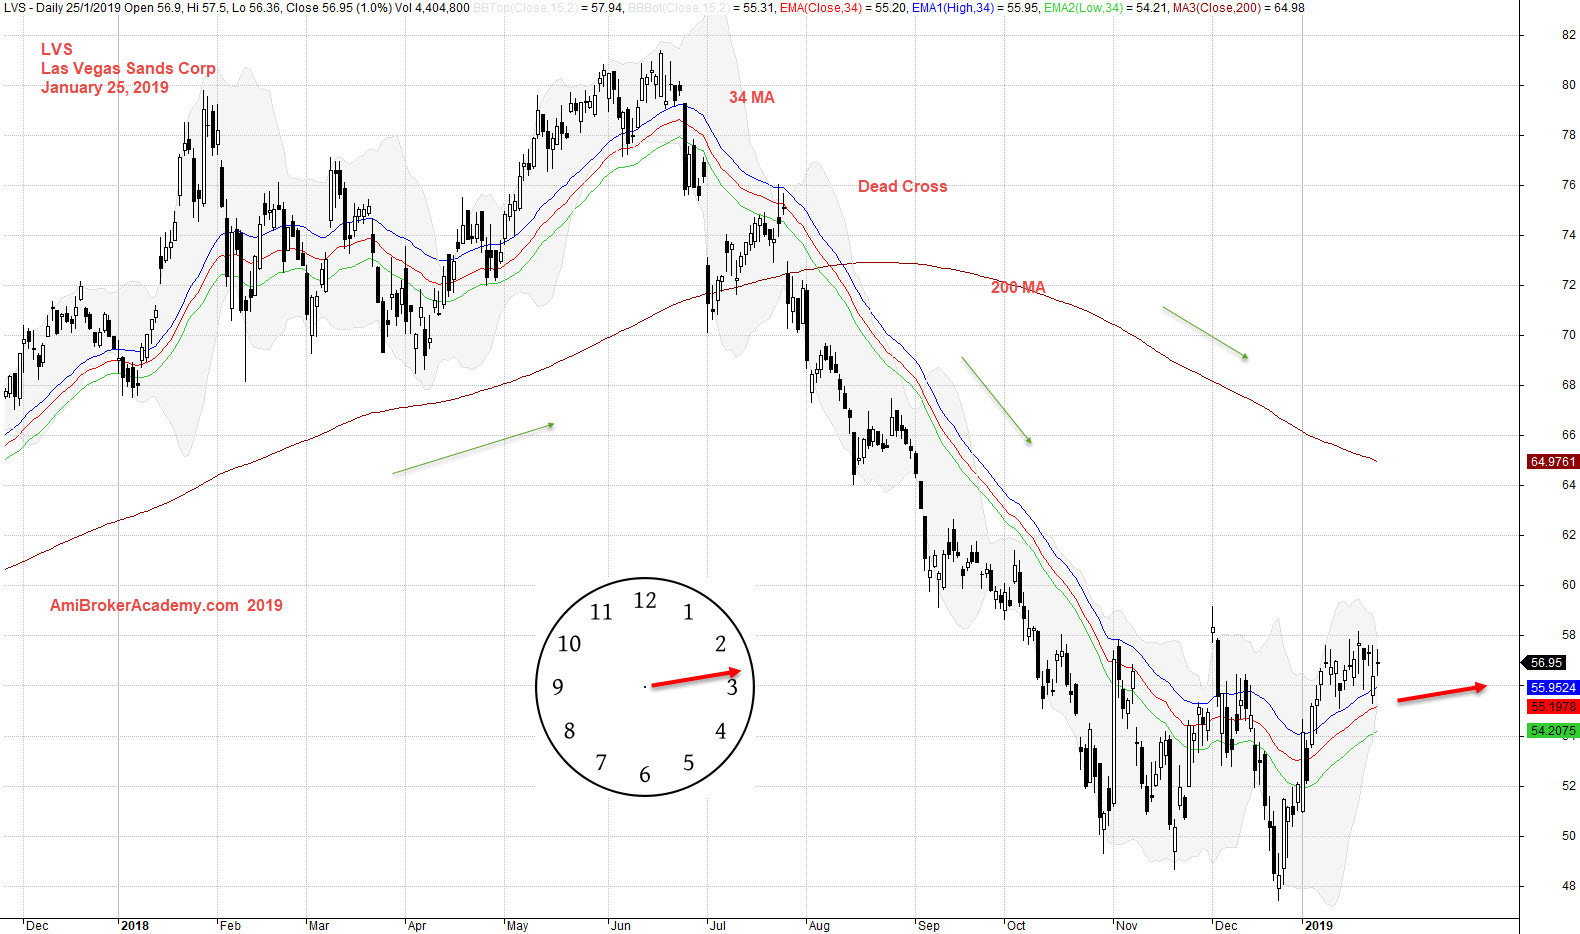
LVS Las Vegas Sands Corporation Stock Charting
Study Las Vegas Sands Corporation stock chart using moving averages. Add 34 period high low and close Moving Average, River and 200 MA.
See chart, picture worth a thousand words.
34 MA close below 200 MA, dead cross. Price action close below 34 MA and stay below. 34 MA slopping down, bear trend.
Price action after test and retest 80 dollars, the price action below to fail and move south. Price action finally stop after tested 48 dollars.
Trade with eyes open.
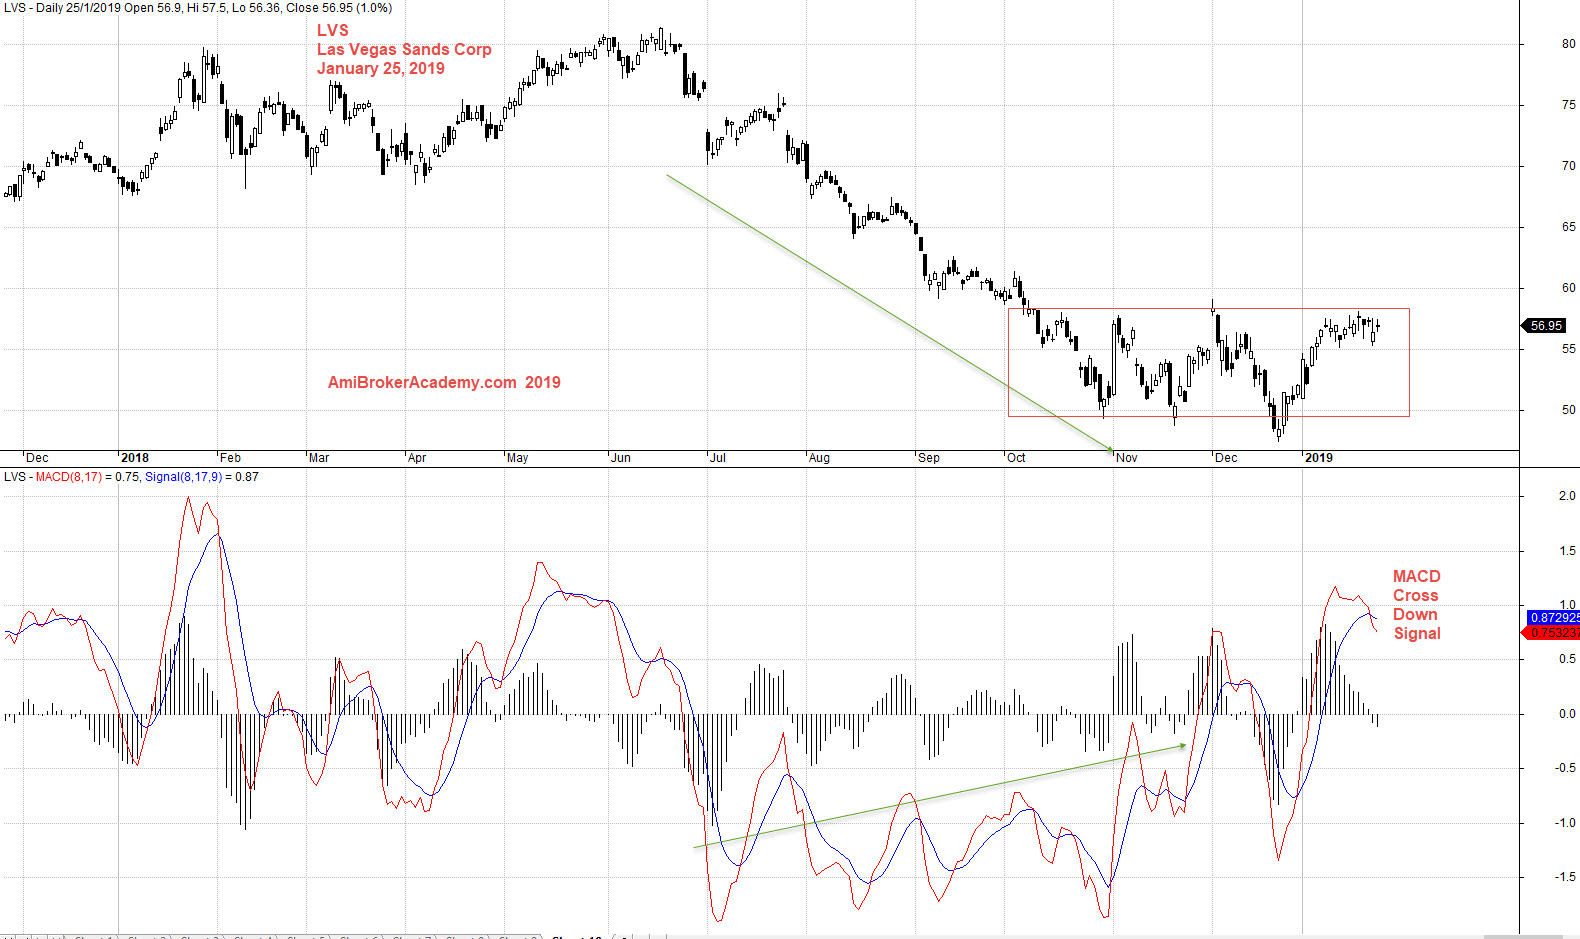
Use MACD indicator, see chart price action continue to form lower low, but MACD Histogram begin to form higher low; positive divergence.
See chart, price action after test the low of 50 dollars and begin to move sideways, see the box.
Price action begin to reversal, will see.
Trade with eyes open.
Moses Stock Analysis
AmiBrokerAcademy.com
Disclaimer
The above result is for illustration purpose. It is not meant to be used for buy or sell decision. We do not recommend any particular stocks. If particular stocks of such are mentioned, they are meant as demonstration of Amibroker as a powerful charting software and MACD. Amibroker can program to scan the stocks for buy and sell signals.
These are script generated signals. Not all scan results are shown here. The MACD signal should use with price action. Users must understand what MACD and price action are all about before using them. If necessary you should attend a course to learn more on Technical Analysis (TA) and Moving Average Convergence Divergence, MACD.
Once again, the website does not guarantee any results or investment return based on the information and instruction you have read here. It should be used as learning aids only and if you decide to trade real money, all trading decision should be your own.