17 September 2020
Welcome to AmiBroker Academy, Moses Stock Charting. Thanks for visiting the site.
We mainly use the powerful AmiBroker charting software tool for our chart and stock scan.
Our intense illustrate to trade well, you need ans simple to use charting tool.
We use different approaches to summarize any complex, confuse price action charting into visual, easy understanding chart.
Trade with eyes open. Manage your risk. Have fun!
Think Think Got More Things
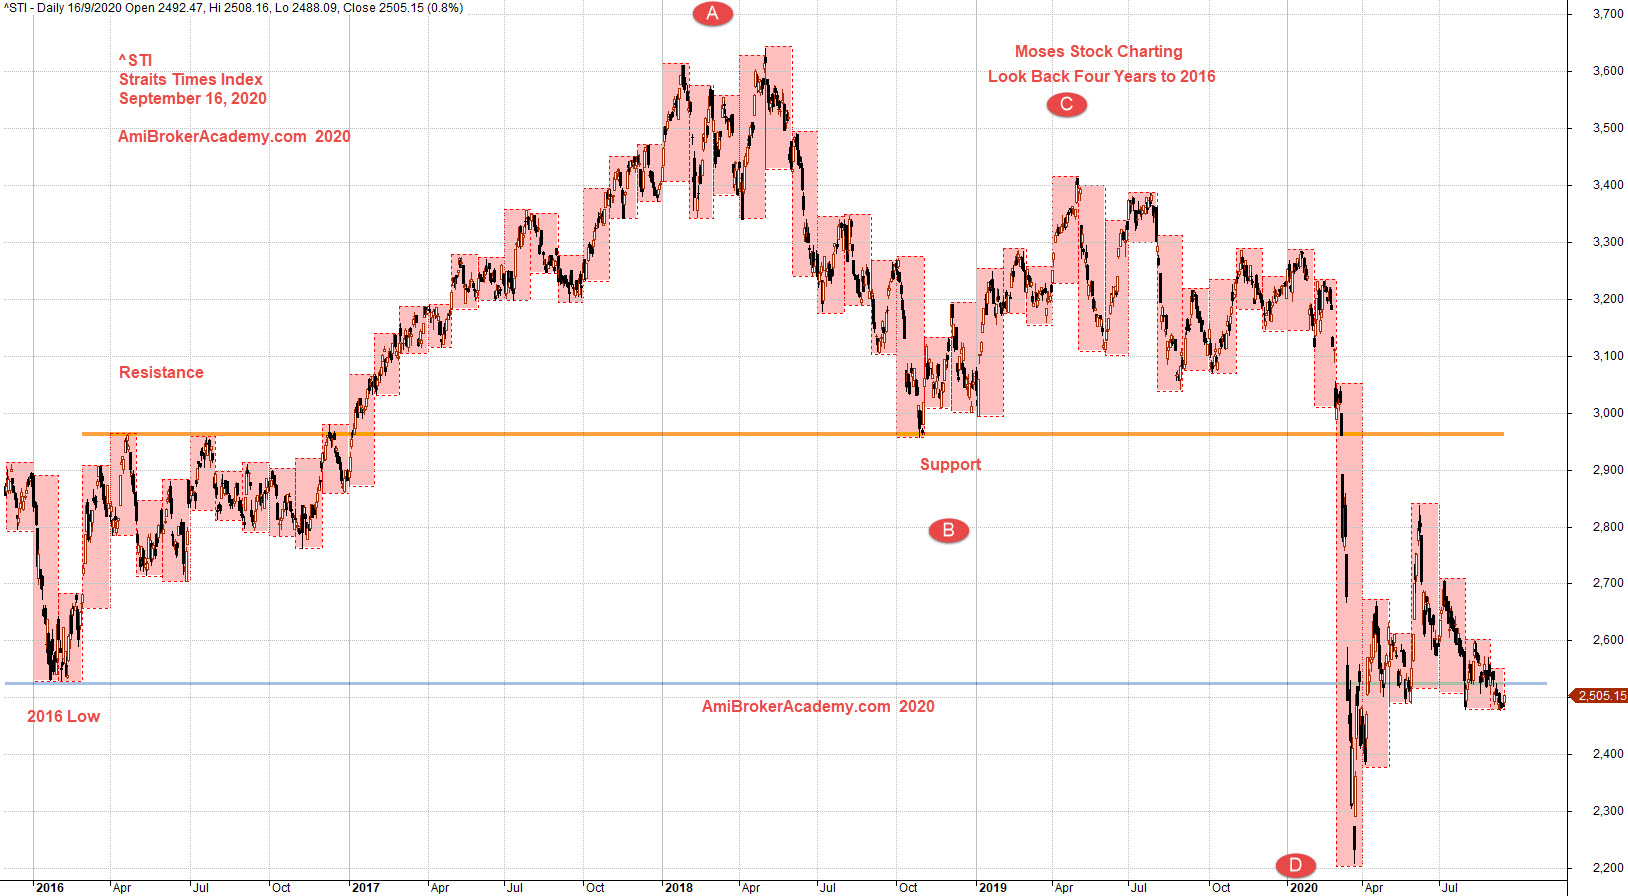
^STI | Straits Times Index Stock Charting
Study Straits Times Index Stock Charting and Price Action.
Look back to 2016 year low, 2528.44 points. Price Action goes up to the peak, 3587.69 on May 3, 2018 and come down to the low this year at 2291.25 level, for the law of nature, what’s goes up must come down. This is the low of the gravity.
Picture worth a thousand words. See chart.
Trade with eyes open. Mange your risk.
We use indicator, but we read chart on their price action. Don’t miss taken.
Price Action
Price Action moves in zigzag manner.
Support Resistance or Trendline
Buy Support Sell Resistance.
Indicator
We use indicator like Bollinger Bands to simplify the complex price action into manageable visual chart. Box is another good tool, and box is not an indicator. Box the high and the low for a week, month, quarter or year.
Box
Boxes provide a very good visual effect on a strong level, support and resistance. See chart.
H M Gartley
If you are fan of Gartley, you probably spot the huge ABCD pattern. Have fun!
Moses Stock Observation
AmiBrokerAcademy.com
Disclaimer
The above result is for illustration purpose. It is not meant to be used for buy or sell decision. We do not recommend any particular stocks. If particular stocks of such are mentioned, they are meant as demonstration of Amibroker as a powerful charting software and MACD. Amibroker can program to scan the stocks for buy and sell signals.
These are script generated signals. Not all scan results are shown here. The MACD signal should use with price action. Users must understand what MACD and price action are all about before using them. If necessary you should attend a course to learn more on Technical Analysis (TA) and Moving Average Convergence Divergence, MACD.
Once again, the website does not guarantee any results or investment return based on the information and instruction you have read here. It should be used as learning aids only and if you decide to trade real money, all trading decision should be your own.