13 October 2018
Singapore Stock Stories
Welcome to AmiBrokerAcademy.com. Thanks for visiting the site.
STI The Straits Times Index Charting
Study Support Resistance and Apply Buy Low Sell High Strategy
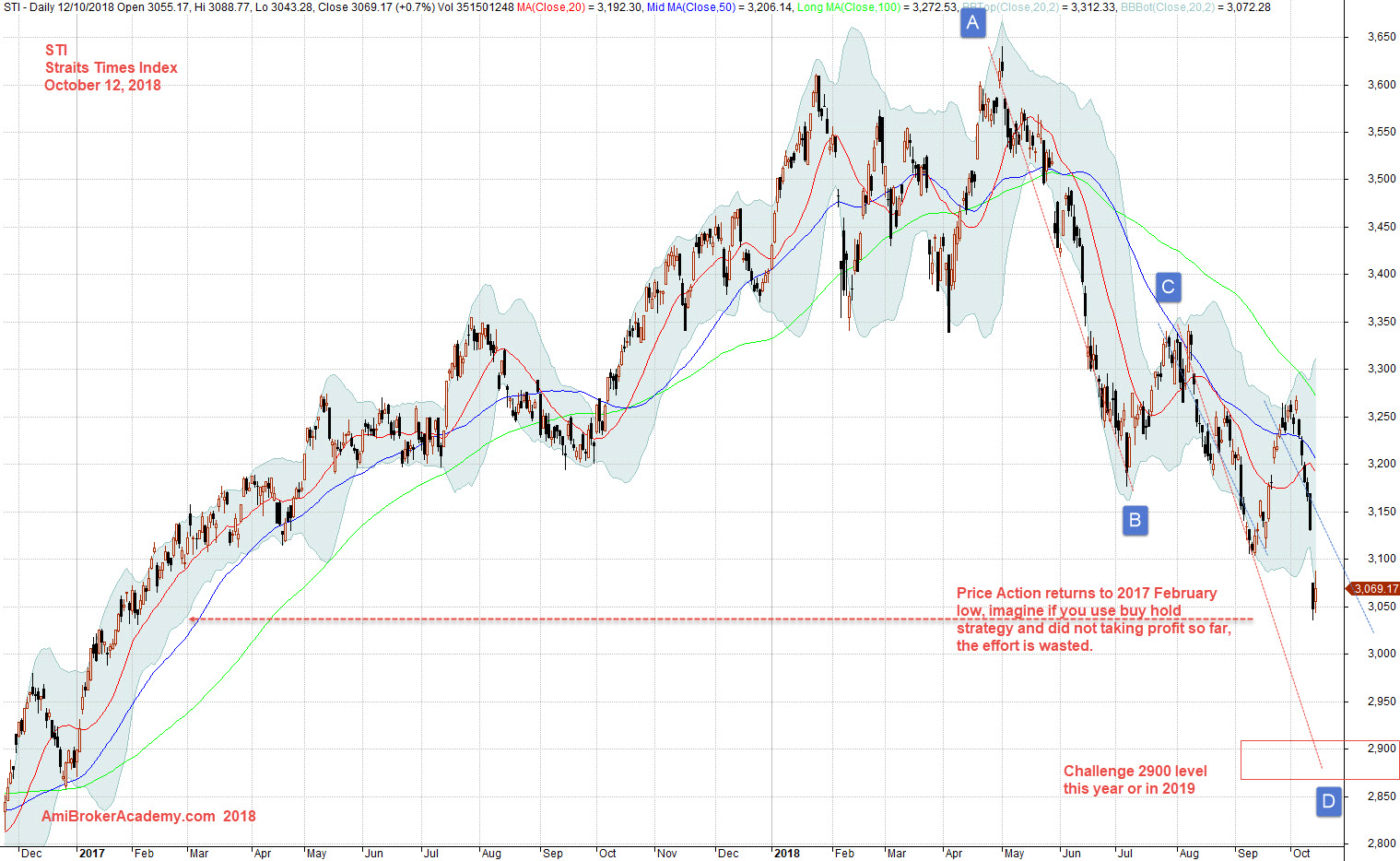
To maximize your profit and minimize risk is to apply buy low sell high strategy, in order to apply the strategy you have to identify the support resistance. Study Straits Times Index chart, picture worth a thousand words. This is only a projection, a project from technical analysis view point. If you are H M Gartley admire, you will know H M Gartley is very powerful. See chart, the price action went from 3350 points and tested above 3600 points. Then the price action closes below 50 period MA and 100 period MA. See the ABCD pattern we indicate. The price action resisted by MA.
Our projection is the price action is targeted to test 2900 points.
Projection is projection, as in technical analysis, all setup can fail.
Trade with eyes open.
Manage your risk.
October 12, 2018 The Straits Time Index Projection
If you can see the whole chart, “press Ctrl and -” to zoom out.
From a twelve months performance, see chart, picture worth a thousand words. Price action goes as low as in February 2017 low. So, do not play play with H M Gartley pattern.
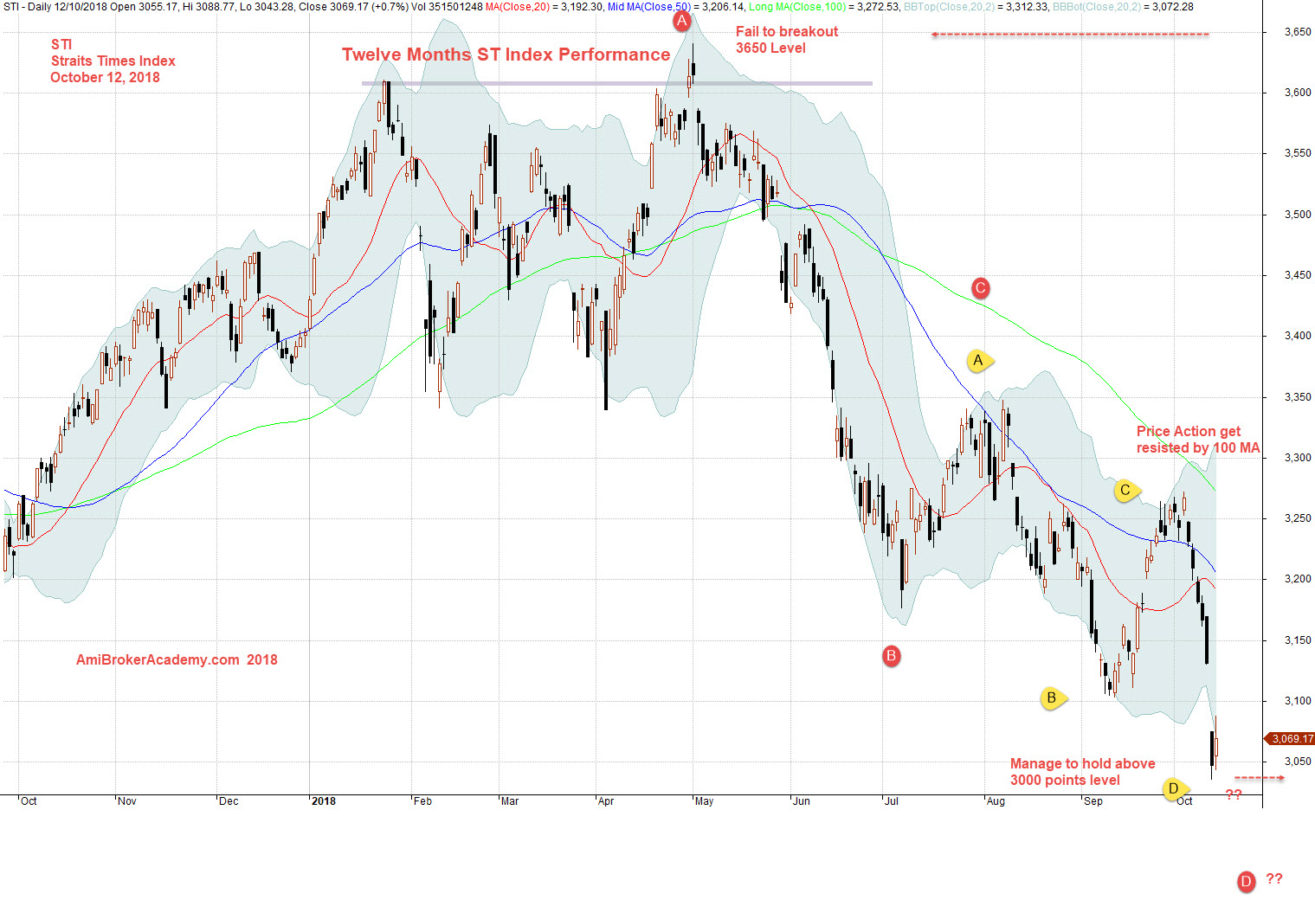
October 12, 2018 The Straits Times Index Twelve Months Performance
Add a MACD indicator, see chart. Picture worth a thousand words.
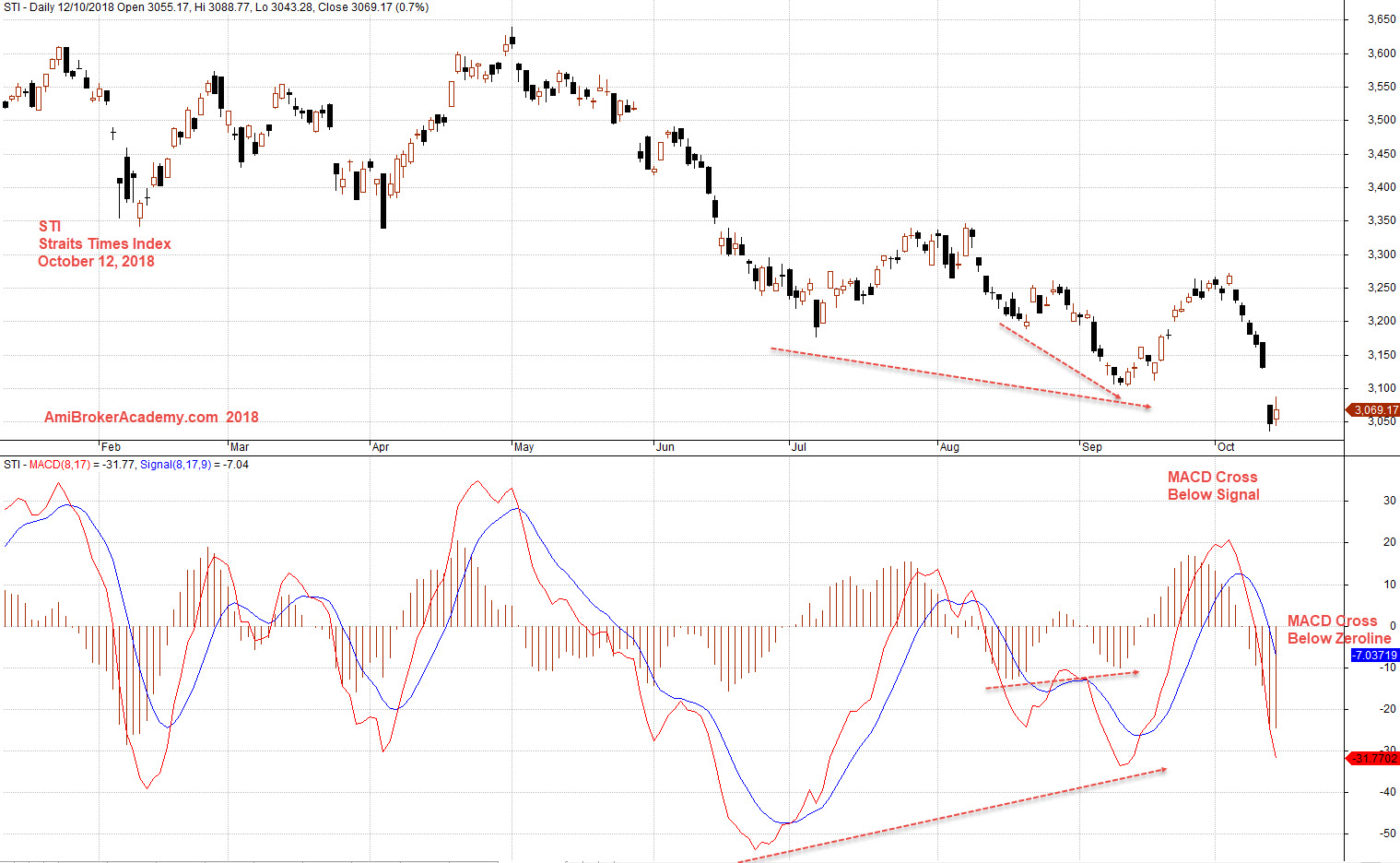
October 12, 2018 Straits Times Index and MACD
Moses
AmiBrokerAcademy.com – we are different
Disclaimer
The above result is for illustration purpose. It is not meant to be used for buy or sell decision. We do not recommend any particular stocks. If particular stocks of such are mentioned, they are meant as demonstration of Amibroker as a powerful charting software and MACD. Amibroker can program to scan the stocks for buy and sell signals.
These are script generated signals. Not all scan results are shown here. The MACD signal should use with price action. Users must understand what MACD and price action are all about before using them. If necessary you should attend a course to learn more on Technical Analysis (TA) and Moving Average Convergence Divergence, MACD.
Once again, the website does not guarantee any results or investment return based on the information and instruction you have read here. It should be used as learning aids only and if you decide to trade real money, all trading decision should be your own.