3 January 2019
Think think got more things.
Thanks for visiting the site.
BABA Alibaba Group Holding Daily Chart
We believe in Buy Low Sell High
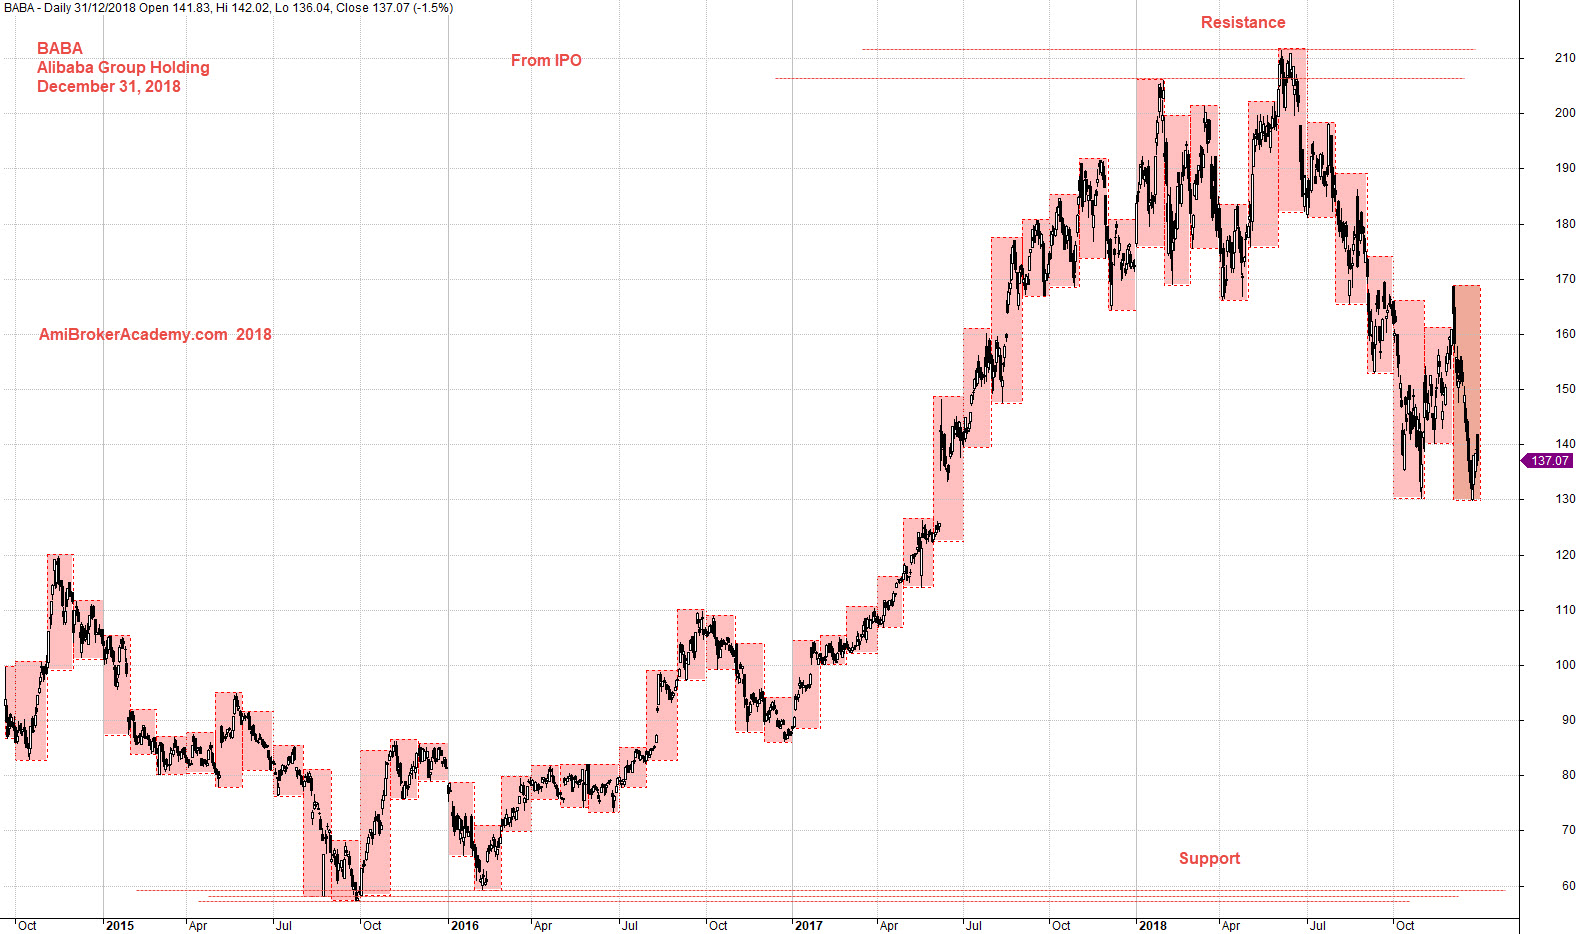
in other words Buy Support Sell Resistance
Read Your Crystal Ball
Look left and think right. What can you see from gazing your crystal ball? I do not know what is your crystal ball shows you, for me I know for sure, for next year or more, the price action will first be inside 210 dollars and 60 dollars.
There will be more people going online and shop. But there are so many online stores now. The more reliable one, like Amazon will continue to be many first choice. Of course there are many willing to the risk to buy cheap on those new up and coming website.
From a trading technical perspective, the price action will continue to be trapped within the support and resistance until either one is broken.
Trade with your eyes open.
if you can see the full chart, “press Ctrl and -” to zoom out and see the entire chart.
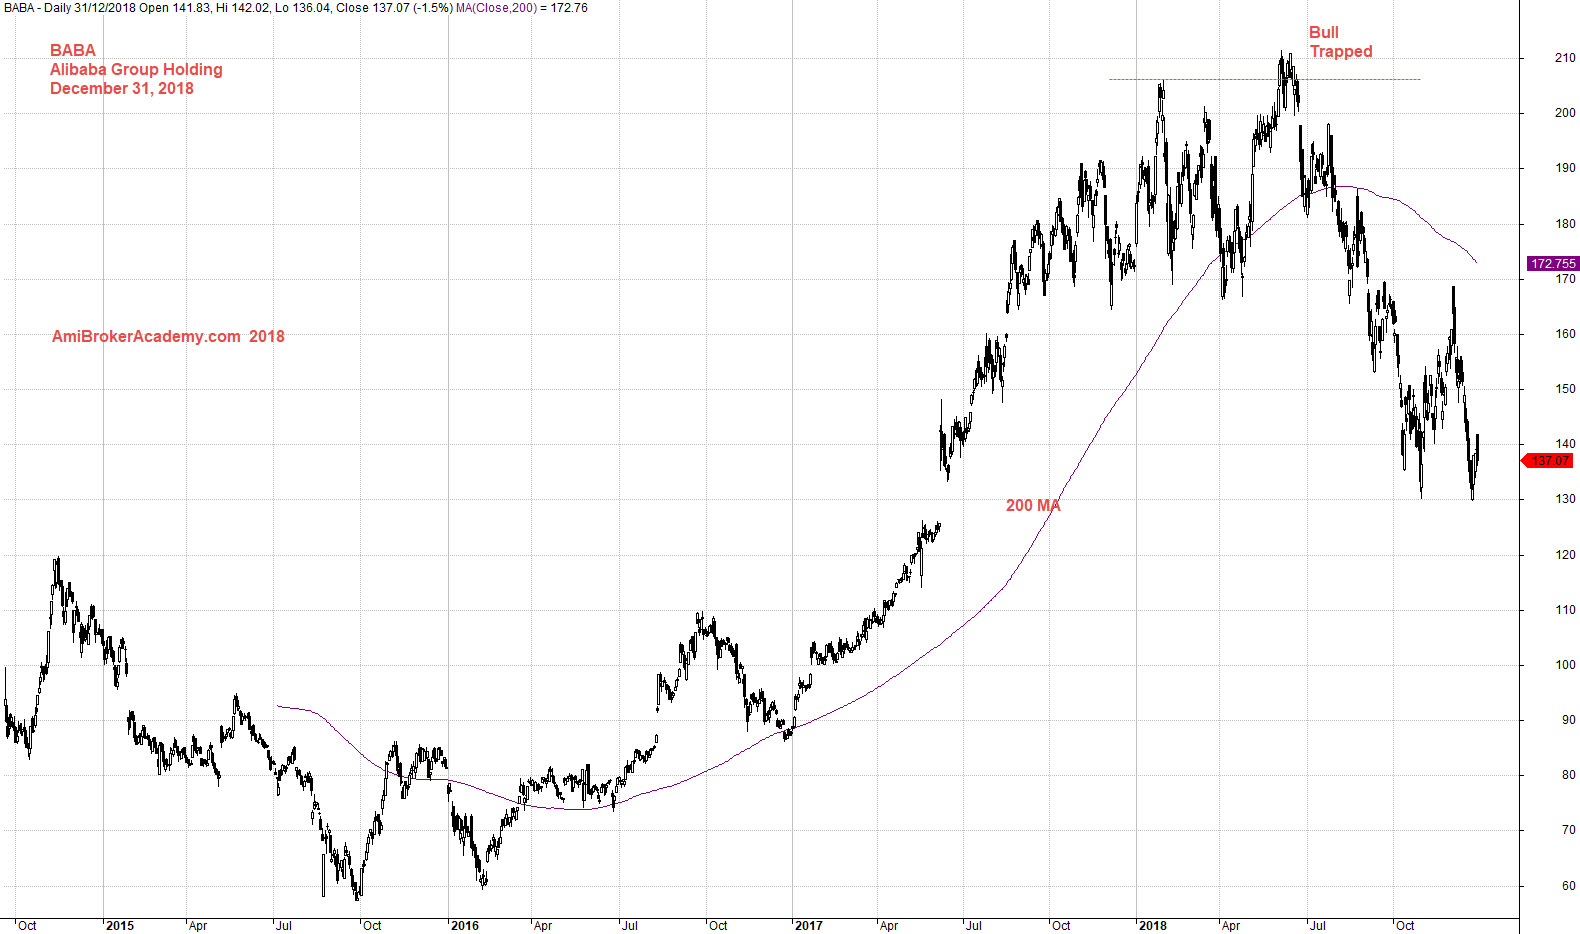
Moving Average is a great visual to spot the bull or bear trend on price action. See chart, the price action is currently cross and stay below MA, 200 MA.
Next if you observe enouth, you will find 200 MA act as resistance to prevent the price action to move higher.
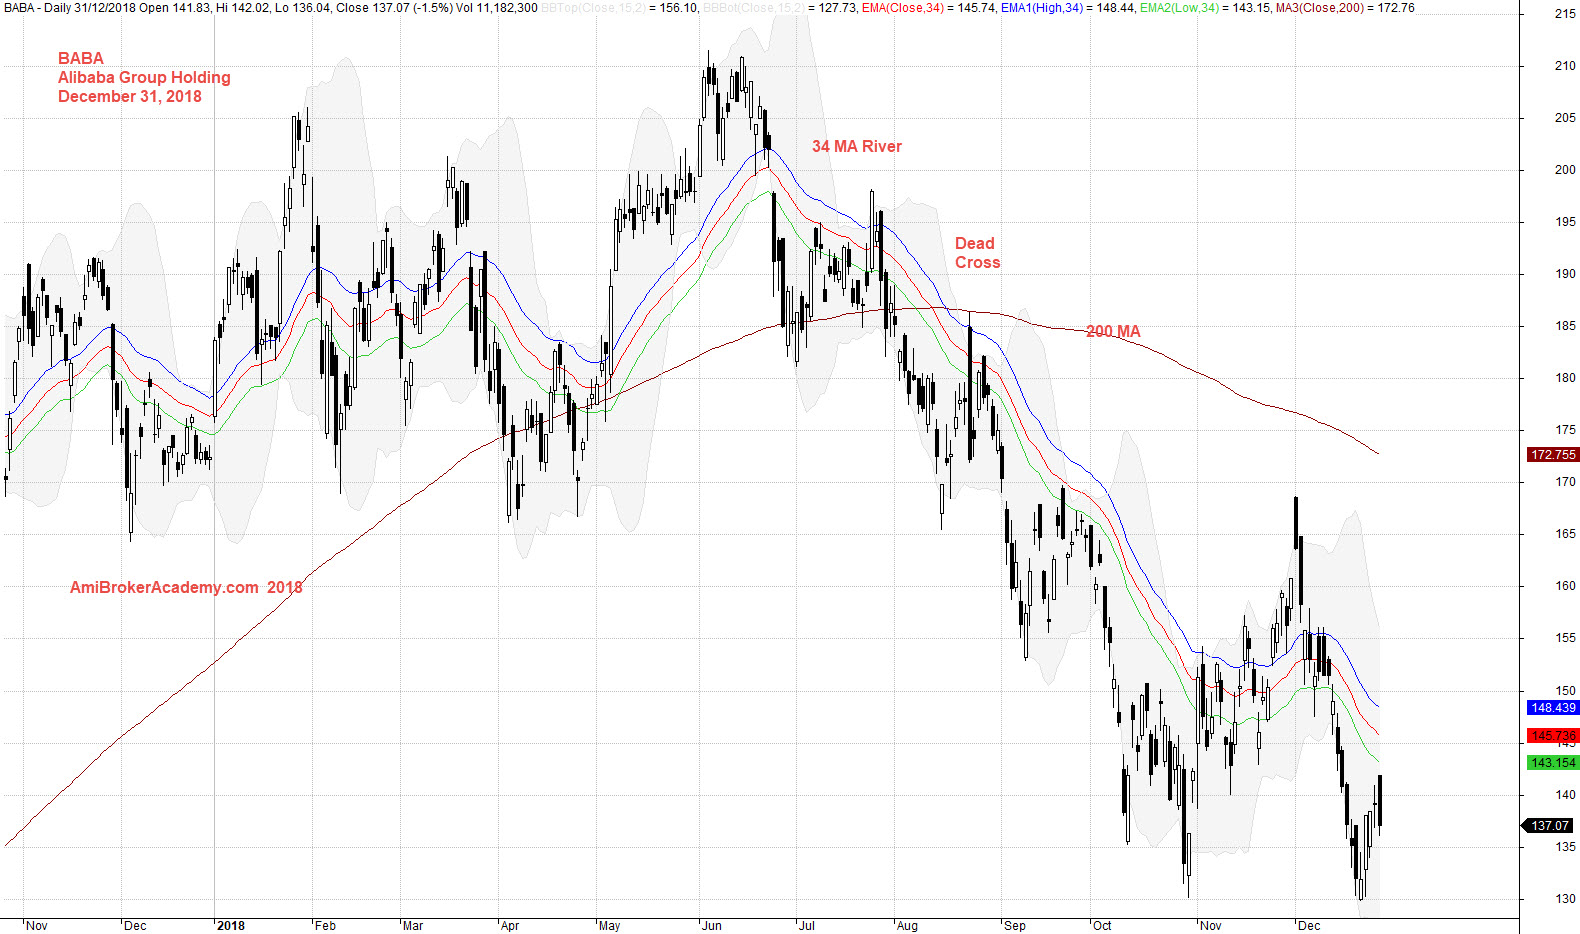
Add 34 period MA, high low and close. You see an even for clear picture on price action and momentum. Study chart for more.
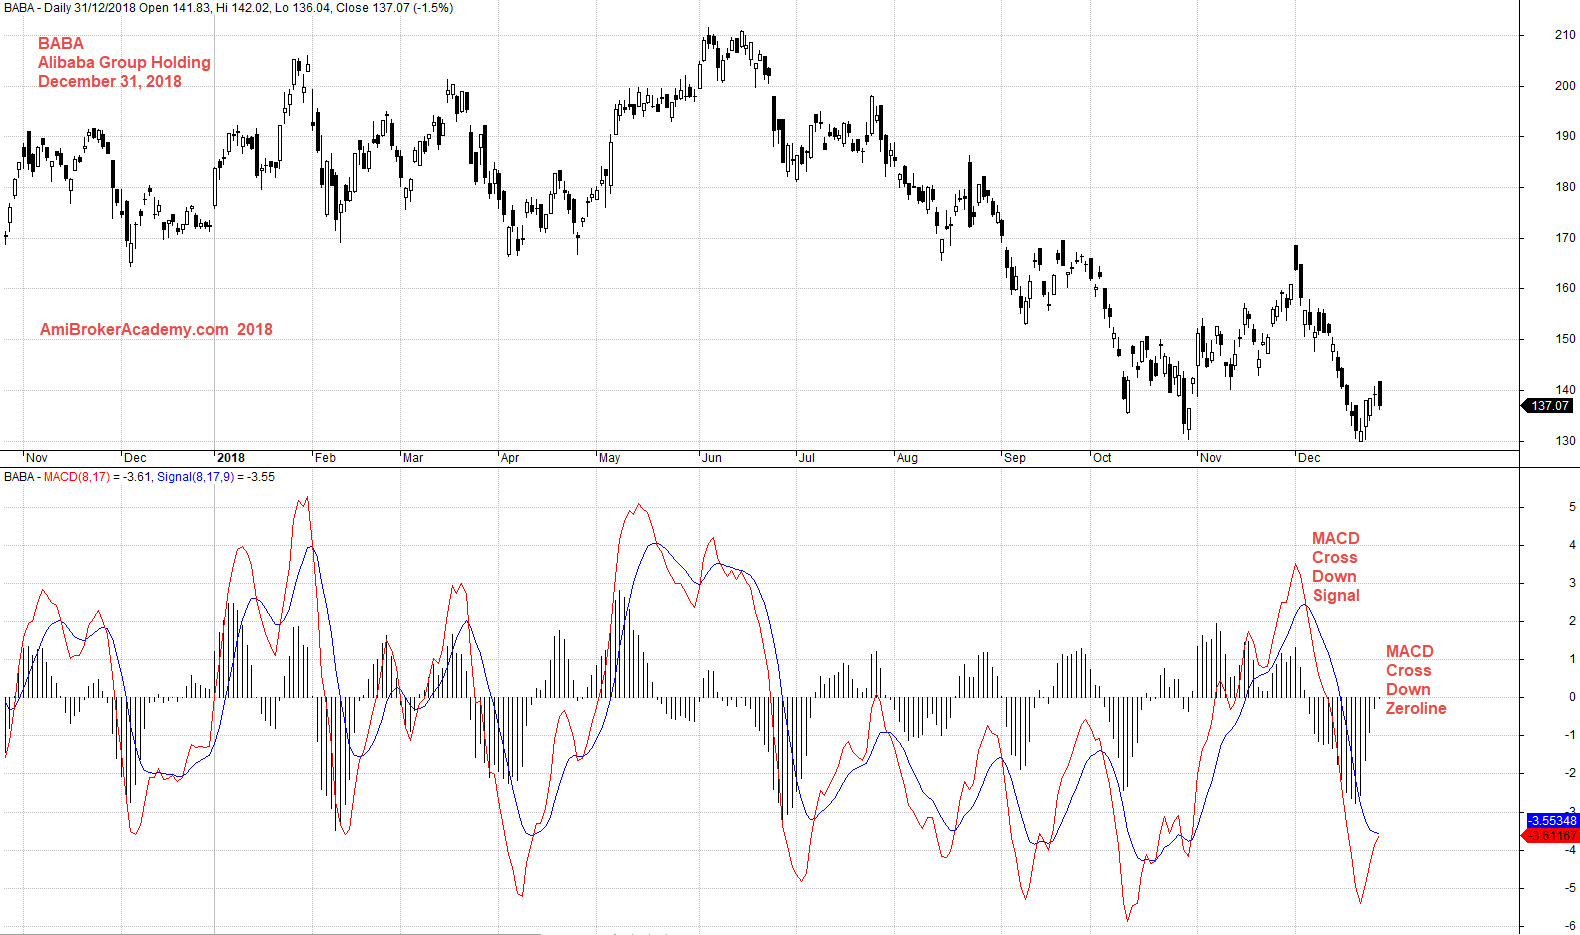
What about MACD indicator? See the price action retest the same low. And MACD is trying to cross up signal.
Moses US Stock Chart Analysis
AmiBrokerAcademy.com
Disclaimer
The above result is for illustration purpose. It is not meant to be used for buy or sell decision. We do not recommend any particular stocks. If particular stocks of such are mentioned, they are meant as demonstration of Amibroker as a powerful charting software and MACD. Amibroker can program to scan the stocks for buy and sell signals.
These are script generated signals. Not all scan results are shown here. The MACD signal should use with price action. Users must understand what MACD and price action are all about before using them. If necessary you should attend a course to learn more on Technical Analysis (TA) and Moving Average Convergence Divergence, MACD.
Once again, the website does not guarantee any results or investment return based on the information and instruction you have read here. It should be used as learning aids only and if you decide to trade real money, all trading decision should be your own.