23 September, 2018
Thanks for visiting the site.
BABA Alibaba Group Holding Charting
Buy Support Sell Resistance or Buy Low Sell High
Study chart of Alibaba stock price and price action. See price action from IPO, you can see BABA continue to form higher high from 2016. The price action continue to test the high of 200. But, now he price test the low of 150. See chart.
Trade with eyes open.
Manage your risk.
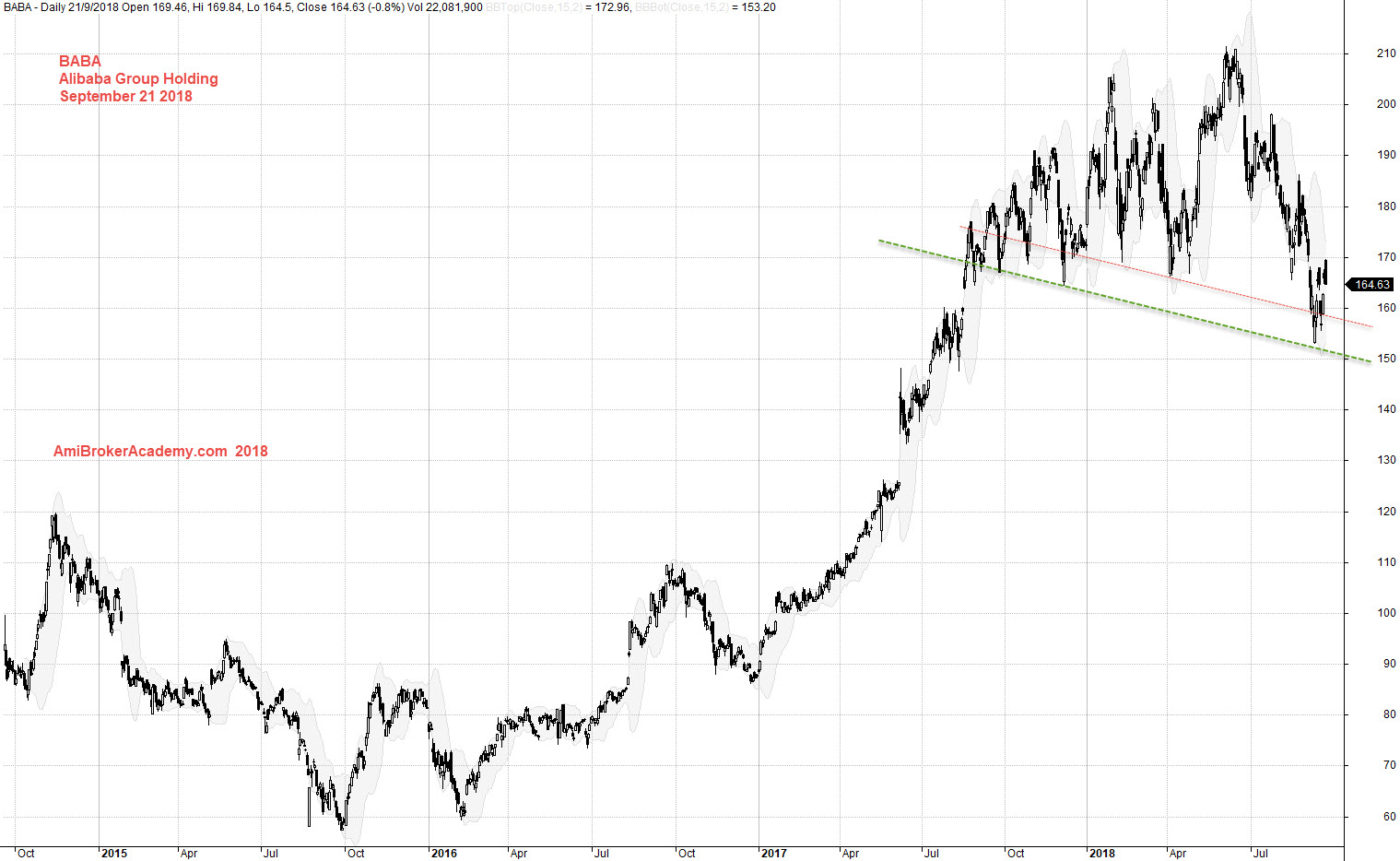
September 21, 2018 Alibaba Group Holding From Day One
if you can see the full chart, “press Ctrl and -” to zoom out and see the entire chart.
Let study the chart from a different perspective, zoom in and add MACD indicator. See chart, price action and MACD signal.
Trade with eyes open. Manage your risk.
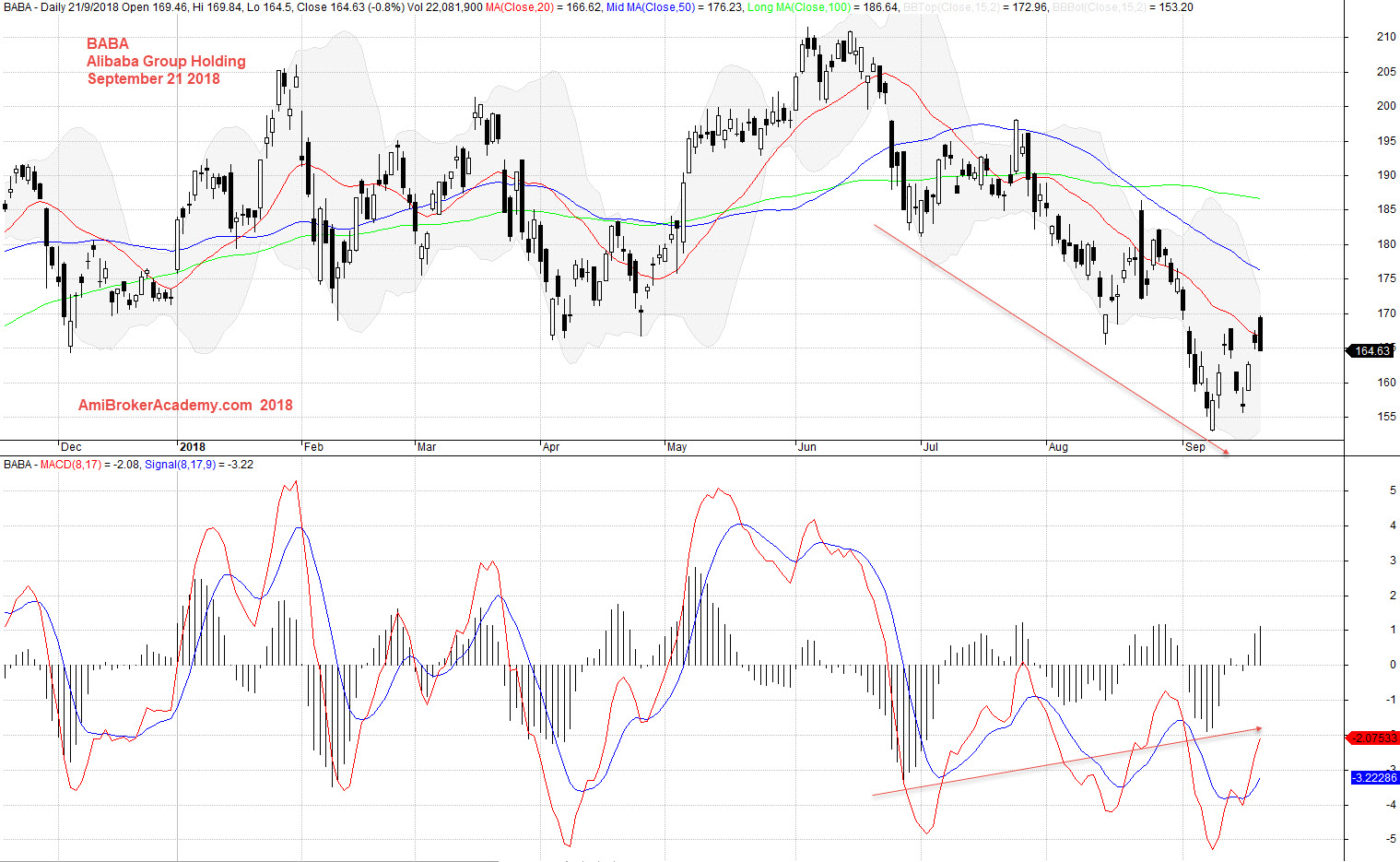
September 21, 2018 Alibaba Group Holding and MACD
Moses US Stock Chart Analysis
AmiBrokerAcademy.com
Disclaimer
The above result is for illustration purpose. It is not meant to be used for buy or sell decision. We do not recommend any particular stocks. If particular stocks of such are mentioned, they are meant as demonstration of Amibroker as a powerful charting software and MACD. Amibroker can program to scan the stocks for buy and sell signals.
These are script generated signals. Not all scan results are shown here. The MACD signal should use with price action. Users must understand what MACD and price action are all about before using them. If necessary you should attend a course to learn more on Technical Analysis (TA) and Moving Average Convergence Divergence, MACD.
Once again, the website does not guarantee any results or investment return based on the information and instruction you have read here. It should be used as learning aids only and if you decide to trade real money, all trading decision should be your own.