26 July 2021
Welcome!
Welcome to AmiBroker Academy dot com, amibrokeracademy.com.
Trading is all probability. You buy or sell from our observation.
Trading is all about observation, reading the price bar and not news. By the time you hear the news it is already old and become history. Why? It is very simple, remember where the news come from? It has first someone release to the news agency like CNBC, and so on. Next, someone has to read the news to you after some research and summarize. This will be few hours later, by then the price action has already done.
As for price bar, it is what the market supply and remand. When market feel that is over price, the price will drop. All this reflected on the price bar almost instantly.
Next is how to read our price bar plus using some tools, such as MACD.
Here, we simply translate price action chart into layman language. This will help you in understand the financial instrument you are trading. We believe picture worth a thousand words. So, sometimes we use less words. You can learn the price action interpretation too. Give it a tray. You may not have the same view points as us. Remember all analysis read price action chart differently. It is just like reading an essay, we will have different conclusion.
Trade well.
Trade what you see. Manage your risk.
1) Ethereum Cryptocurrency and Ichimoku Cloud
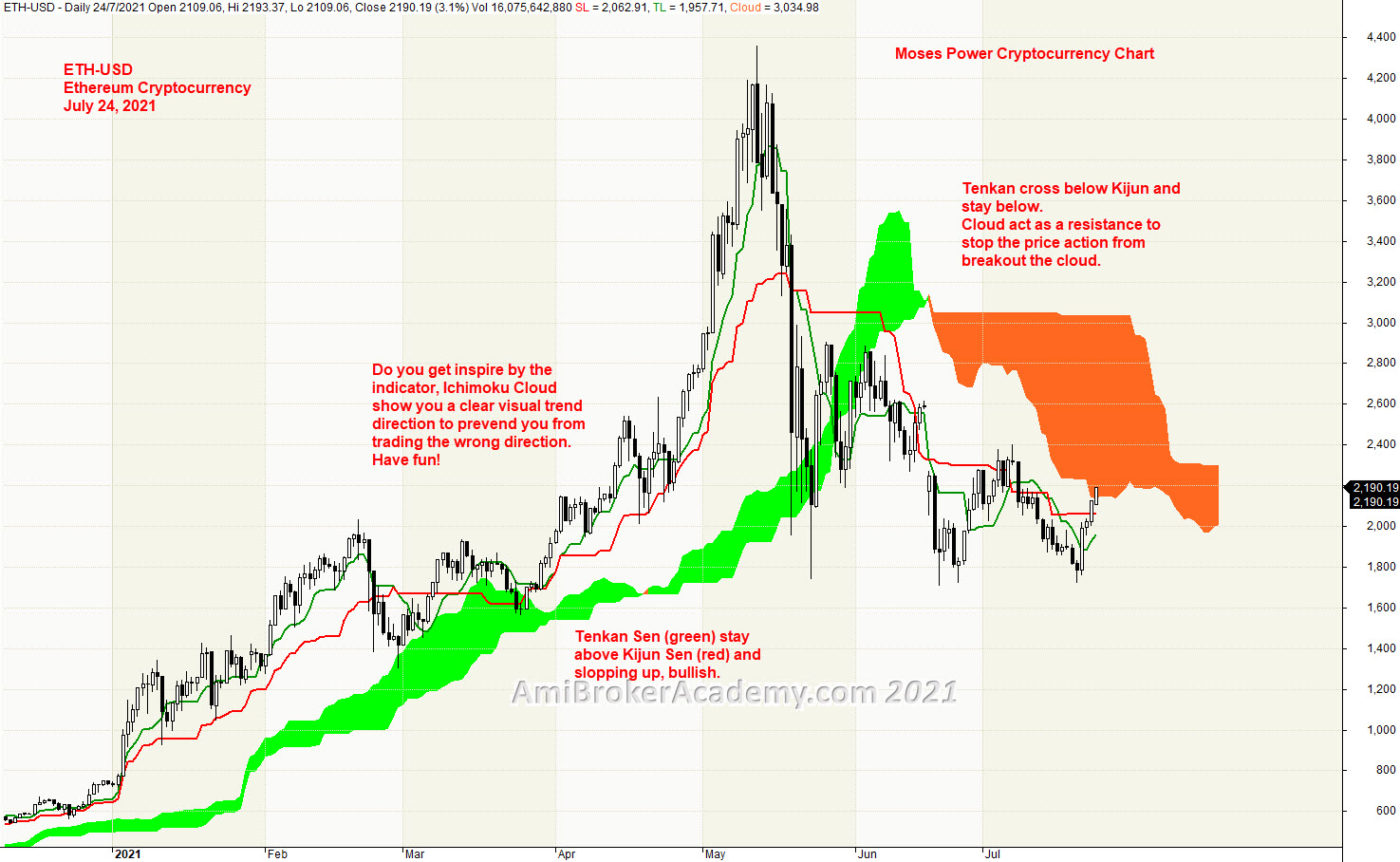
Ichimoku Cloud is a good trend following strategy tool, can use in any market and any timeframe, cryptocurrency is one of them. Ichimoku indicator emphasize to trade in the trend direction. We see price action stay above the cloud and only pullback after peak in May. Now, price action is below cloud.
Read the price action, price action goes from bottom left to the top of the chart. After May, the price action begin to pullback and sink below the cloud. Remember one thing, buy support sell resistance. You can use cloud as resistance when it is in a bear trending. Trade what you see.
Ichimoku is a great visual tool too, to help keep you not trading in the wrong direction. So, Ethereum Crypto has gone from bull to bear. For those not trading the quick in quick out approach, now is not the time to buy hold.
Just to recap, Ichimoku Cloud is a multi-dimensional indicator designed to offer support and resistance levels, trending, and entry and exit points. Ichimoku is an indicator that gauges future price momentum and determine futures areas of support and resistance. Price Action is currently sink below and resisted by cloud.
Remember, we just read what the chart said and think. Think think got more things. We do not and can not personalize the price action to your liking. Have fun!
Don’t play play with Ichimoku indicator. Very simple. Very powerful. AmiBrokerAcademy provides you simple and easy to understand charting. Check out more on Moses power stock chart.
2) Ethereum Cryptocurrency and Support Resistance
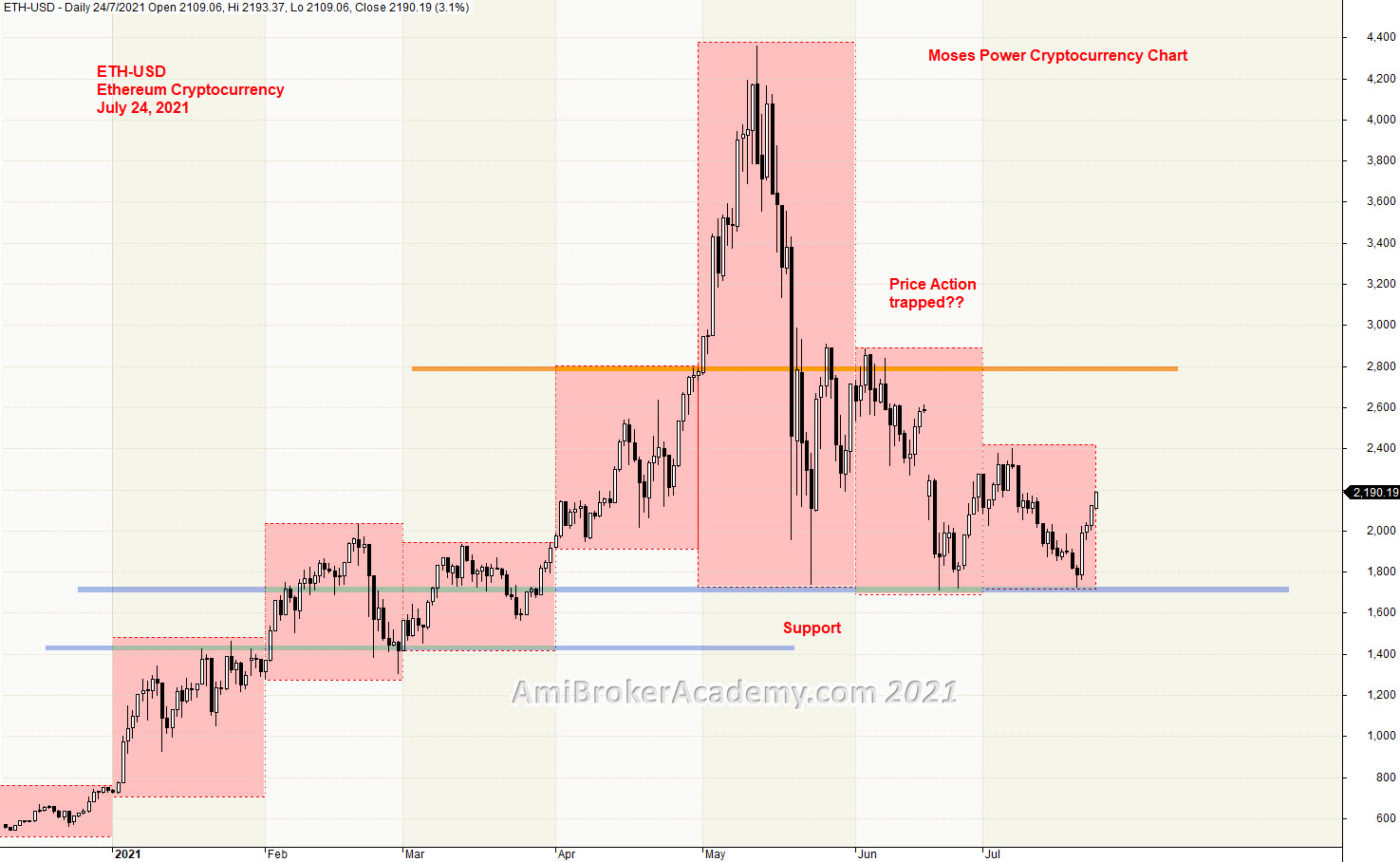
Price Action goes from low to high to low again, here use month high low to find a solid strong support resistance level. See price action get good support between 1,600 and 1,800 dollars level.
From chart, those whom they thought they miss the buy and rush in to buy at 2,800 dollars they got trapped. Trade with eyes open. When unsure, stand aside a wait. Always reduce risk by buy low sell high, or technically, buy support and sell resistance.
Have fun!
3) Ethereum Cryptocurrency and GMMA and Woodies CCI
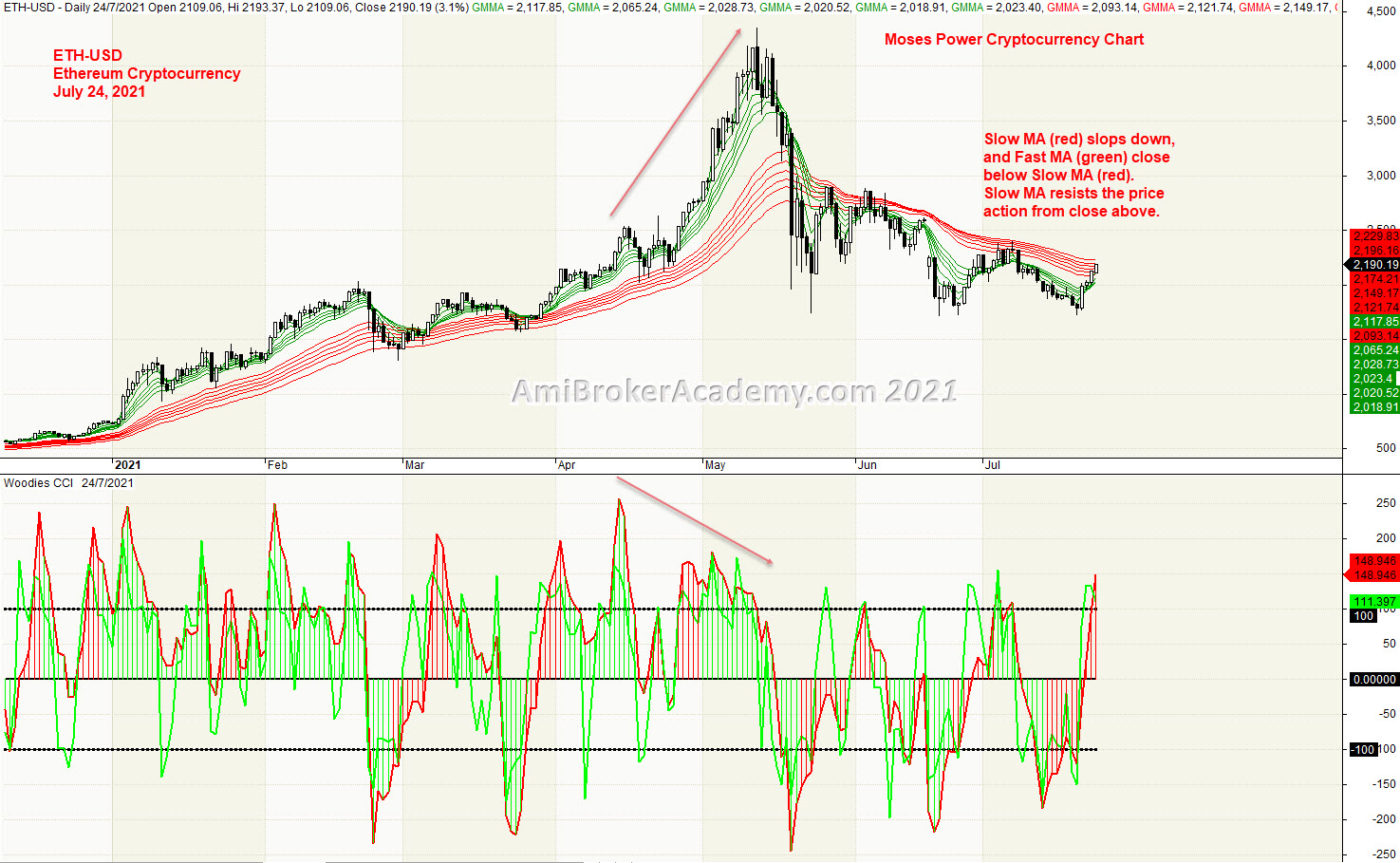
When add GMMA, you could find the green belt go on top of red belt, and green belt sink below red in May. Since then the green stay below red. This is the beauty of GMMA, help you to find the bull and the bear trend.
Slow MA (red) slops up and stay below, bull. Fast MA (green) slops down and go below Slow MA is bear. Trade what you see. Manage your risk.
4) Ethereum Cryptocurrency and River
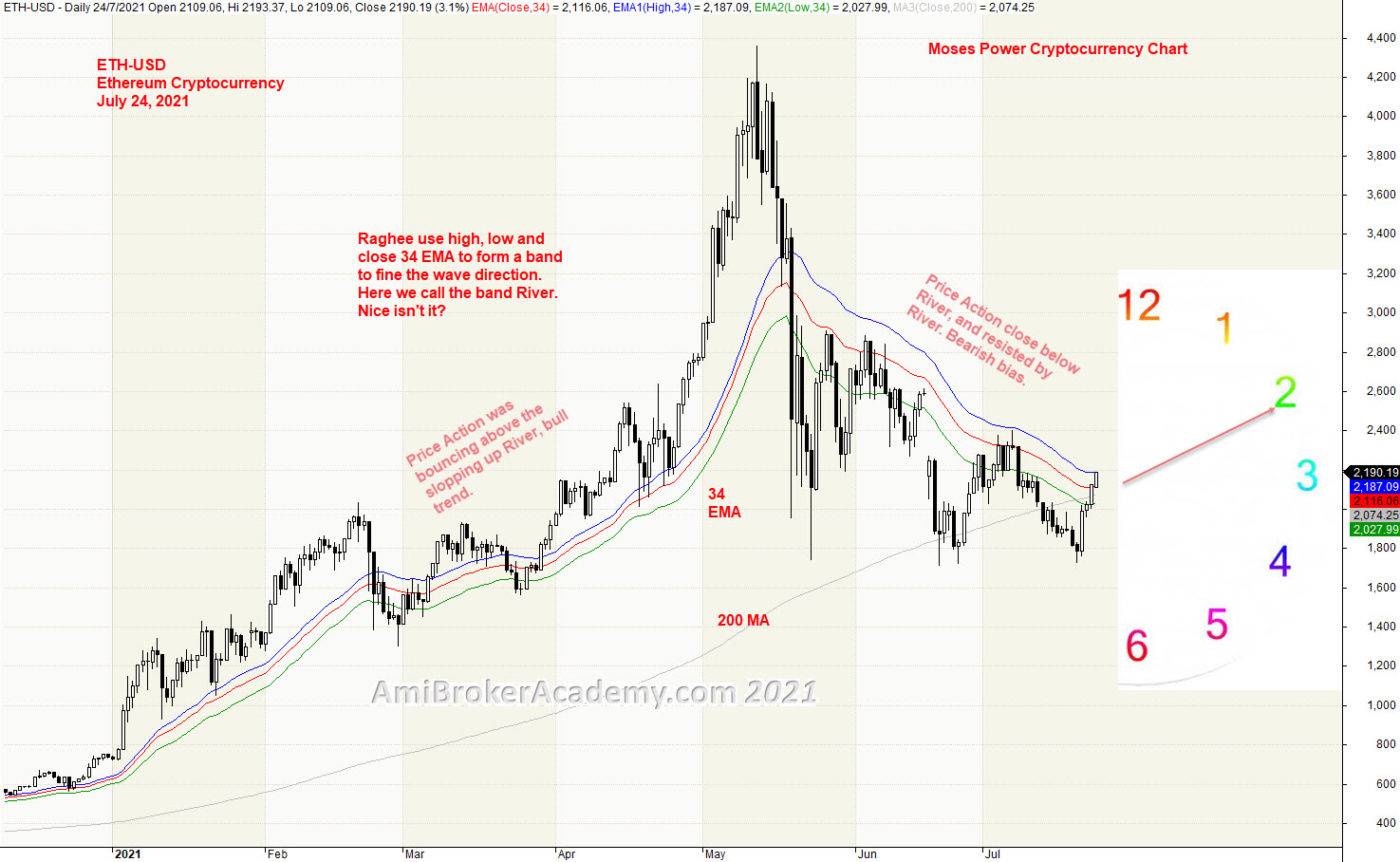
34 EMA slops up and above 200 MA, bull trend. Price Action should also stay above the River at this point. Raghee uses 34 EMA, high, low and close to see the wave direction,
Price Action crosses and closes below River, in May. Price Action try to breakout River but fail. River act as resistance to keep the price action at bay. Price Action has tested the resistance, River a few times. River is slopping down, bear. Bear trending at the moment. Trade with eyes open.
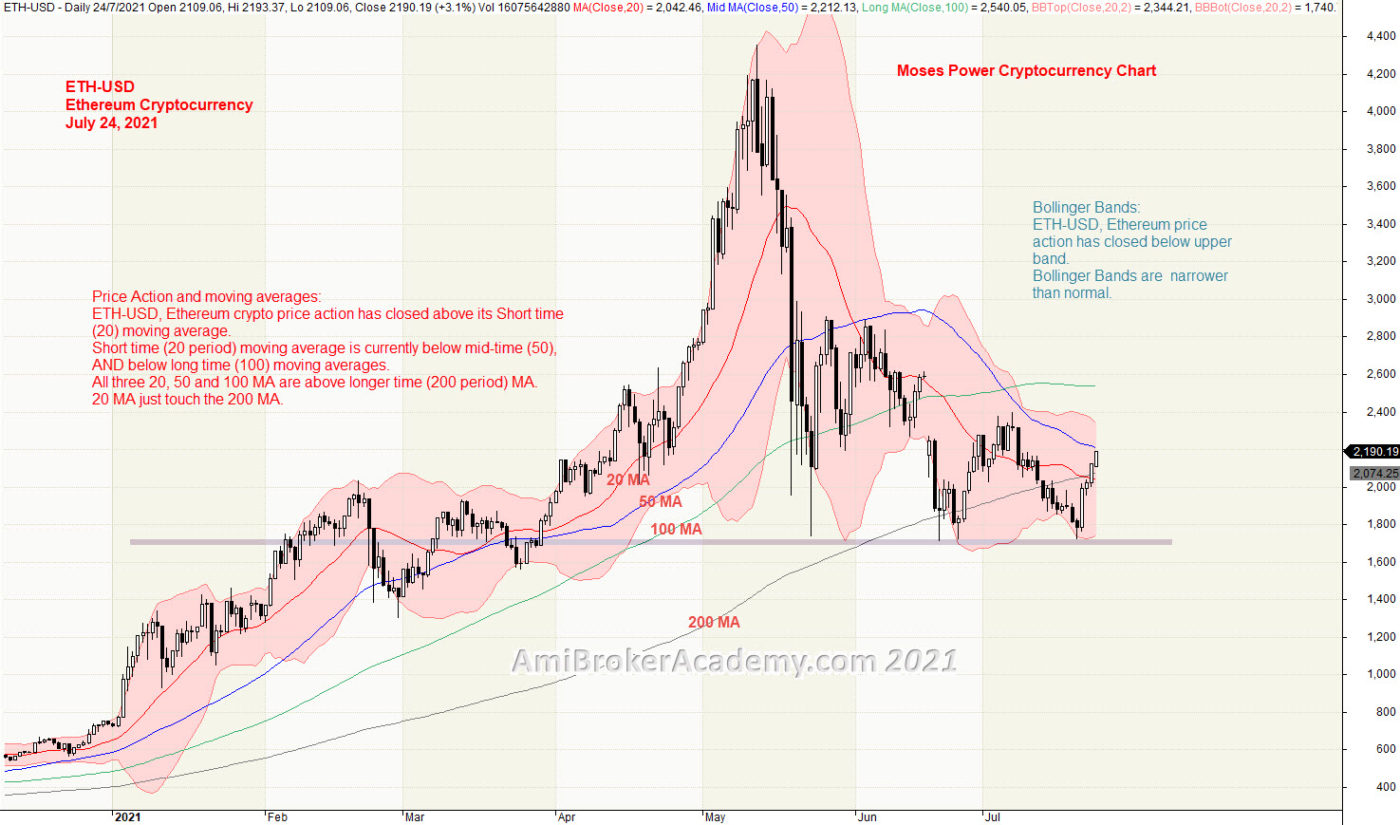
5) Ethereum Cryptocurrency and Bollinger Bands and MA
Bollinger Bands is a very powerful tool, it envelop the price action. When the price action is near upper band, you know you can buy, when price action is at the bottom near lower band, you know sell is the safe bet. Bollinger Bands contract and expand, it goes from low volatility to high.
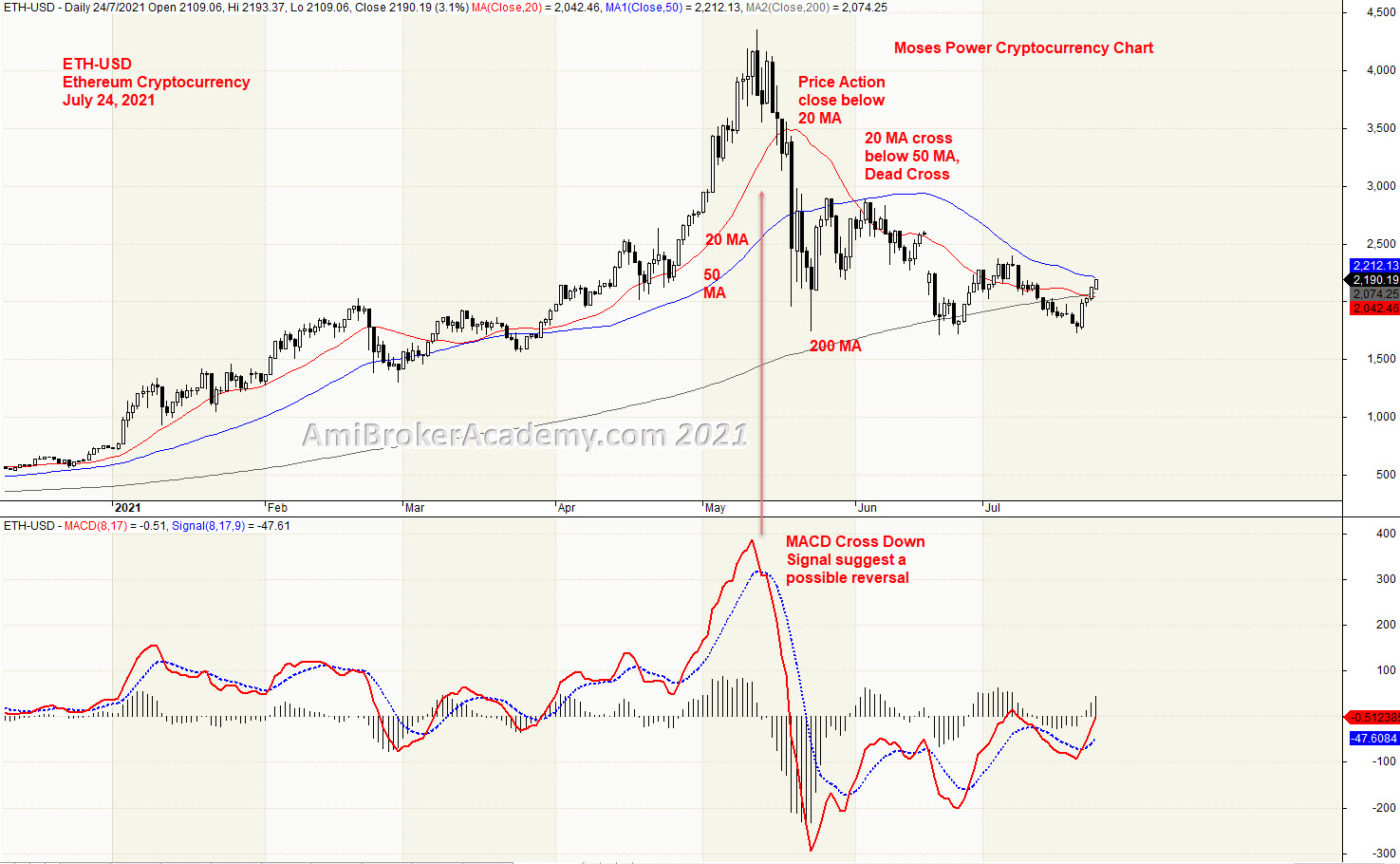
6) Ethereum Cryptocurrency and MACD
MACD is a simple and powerful tool. When MACD cross down signal, it gives you an idea that the price is weaken. It is just like traffic light, you don’t stop at every traffic light, But, the traffic light let you know that you need to stop at the change of light, from green to red.
So, when the MACD cross down signal, be ready to sell. Wait for bear confirmation, it can be bear candlestick, bear chart pattern and so on. Manage your risk and trade with eyes open.
You do not have to wait for news. It is too late! Begin to trade price action with some simple indicator, like MACD.
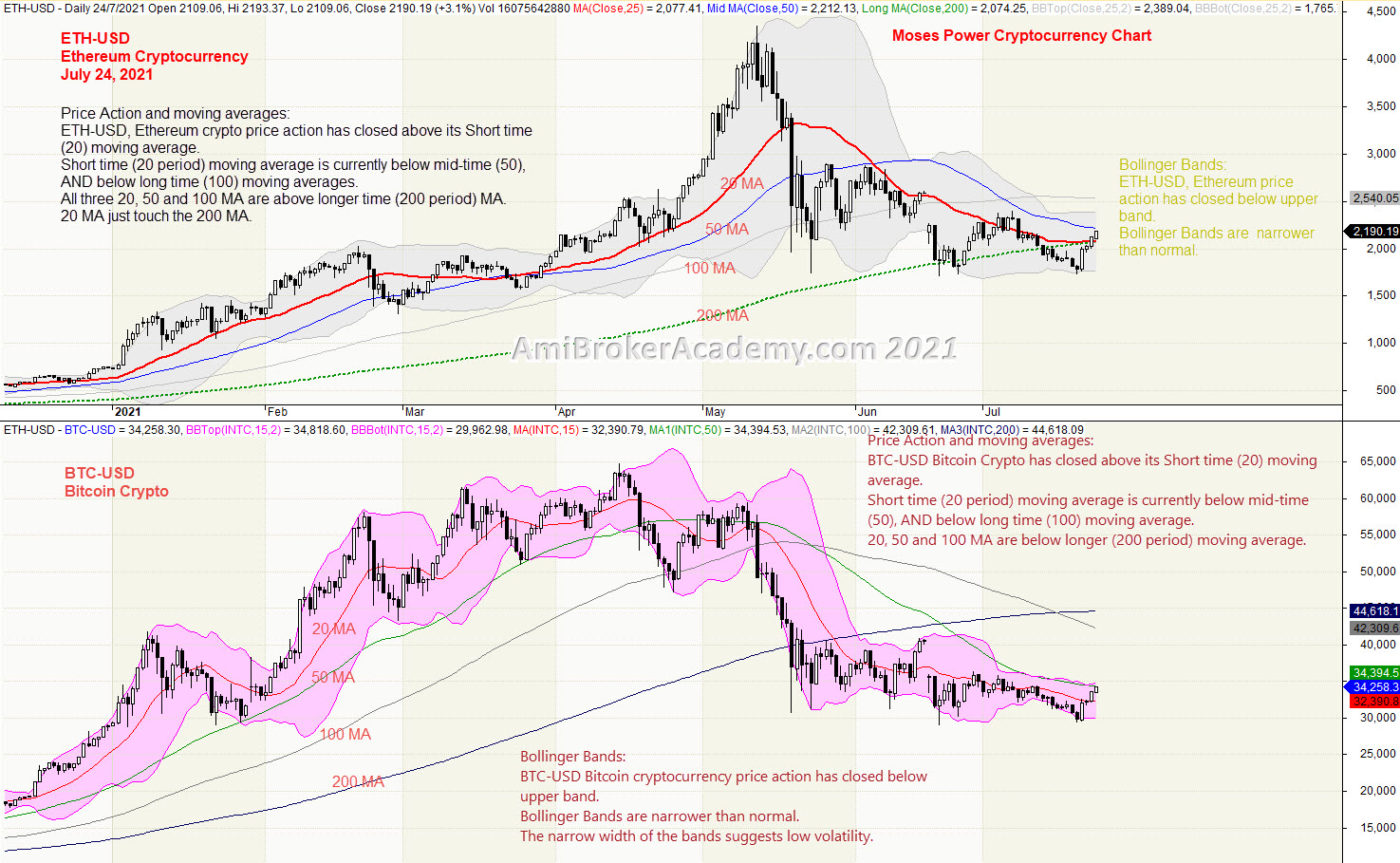
7) Ethereum Crypto and Bitcoin Crypto Correlation
Compare two cryptocurrencies you find the Bitcoin Crypto is leading the way. Picture is worth a thousand words. Have fun!
Moses Power Charting
Official AmiBrokerAcademy.com Charting
Disclaimer
The above result is for illustration purpose. It is not meant to be used for buy or sell decision. We do not recommend any particular stocks. If particular stocks of such are mentioned, they are meant as demonstration of Amibroker as a powerful charting software and MACD. Amibroker can program to scan the stocks for buy and sell signals.
These are script generated signals. Not all scan results are shown here. The MACD signal should use with price action. Users must understand what MACD and price action are all about before using them. If necessary you should attend a course to learn more on Technical Analysis (TA) and Moving Average Convergence Divergence, MACD.
Once again, the website does not guarantee any results or investment return based on the information and instruction you have read here. It should be used as learning aids only and if you decide to trade real money, all trading decision should be your own.
We learn from many past and present great traders. Kudo to these master.