21 July 2021
Welcome!
Welcome to AmiBroker Academy dot com, amibrokeracademy.com.
Trading is all about observation, reading the price bar and not news. By the time you hear the news it is already old and become history. Why? It is very simple, remember where the news come from? It has first someone release to the news agency like CNBC, and so on. Next, someone has to read the news to you after some research and summarize. This will be few hours later, by then the price action has already done.
As for price bar, it is what the market supply and remand. When market feel that is over price, the price will drop. All this reflected on the price bar almost instantly.
Next is how to read our price bar plus using some tools, such as MACD.
Here, we simply translate price action chart into layman language. This will help you in understand the financial instrument you are trading. We believe picture worth a thousand words. So, sometimes we use less words. You can learn the price action interpretation too. Give it a tray. You may not have the same view points as us. Remember all analysis read price action chart differently. It is just like reading an essay, we will have different conclusion.
Trade well.
Trade what you see. Manage your risk.
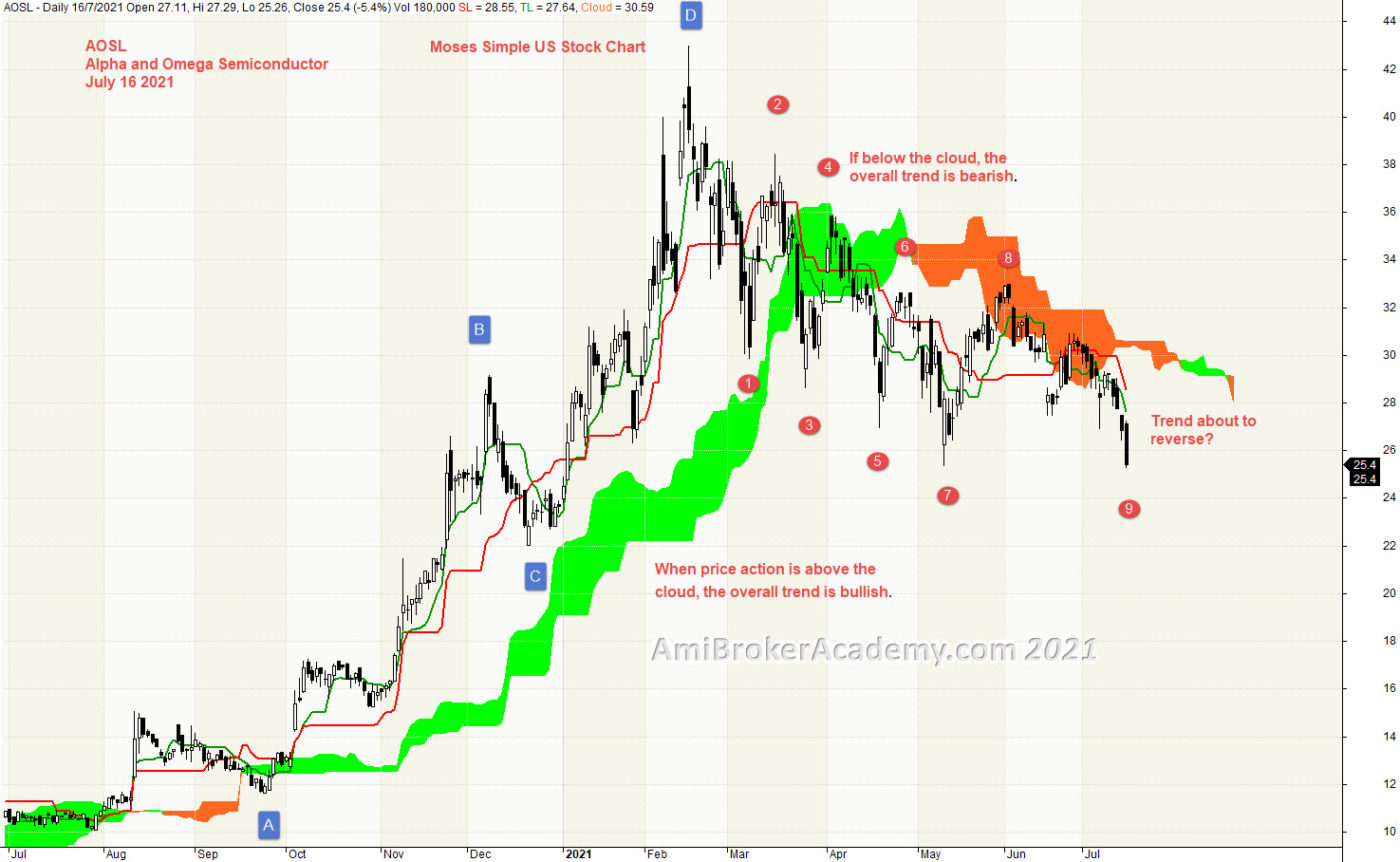
1) AOSL | Alpha and Omega Semiconductor and Ichimoku Cloud
Ichimoku Cloud is a trend following strategy tool, can use in any market and any timeframe. Ichimoku indicator emphasize to trade in the trend direction. We see price action emerge from the cloud. Price Action goes on top of cloud and stay above. Price Action goes from bottom left to top right, ie Bull trend. We see also Tenkan Sen (green) goes above Kijun Sen (red). But after February, Tenkan cross below Kijun and stay below, bear trend.
Ichimoku is a great visual tool too, to help to avoid trading in the wrong direction.
Ichimoku Cloud is a multi-dimensional indicator designed to offer support and resistance levels, trending, and entry and exit points. Besides that, Ichimoku is an indicator that gauges future price momentum and determine futures areas of support and resistance. Price Action is currently below cloud.
Trade what you see. Find a potential support to buy.
Trade what you see.
Remember, we just read what the chart said. Have fun!
But. don’t play play with Ichimoku indicator. Very simple yet powerful. We are here provide you simple yet powerful stock chart. Check out Moses power stock chart. Have fun!
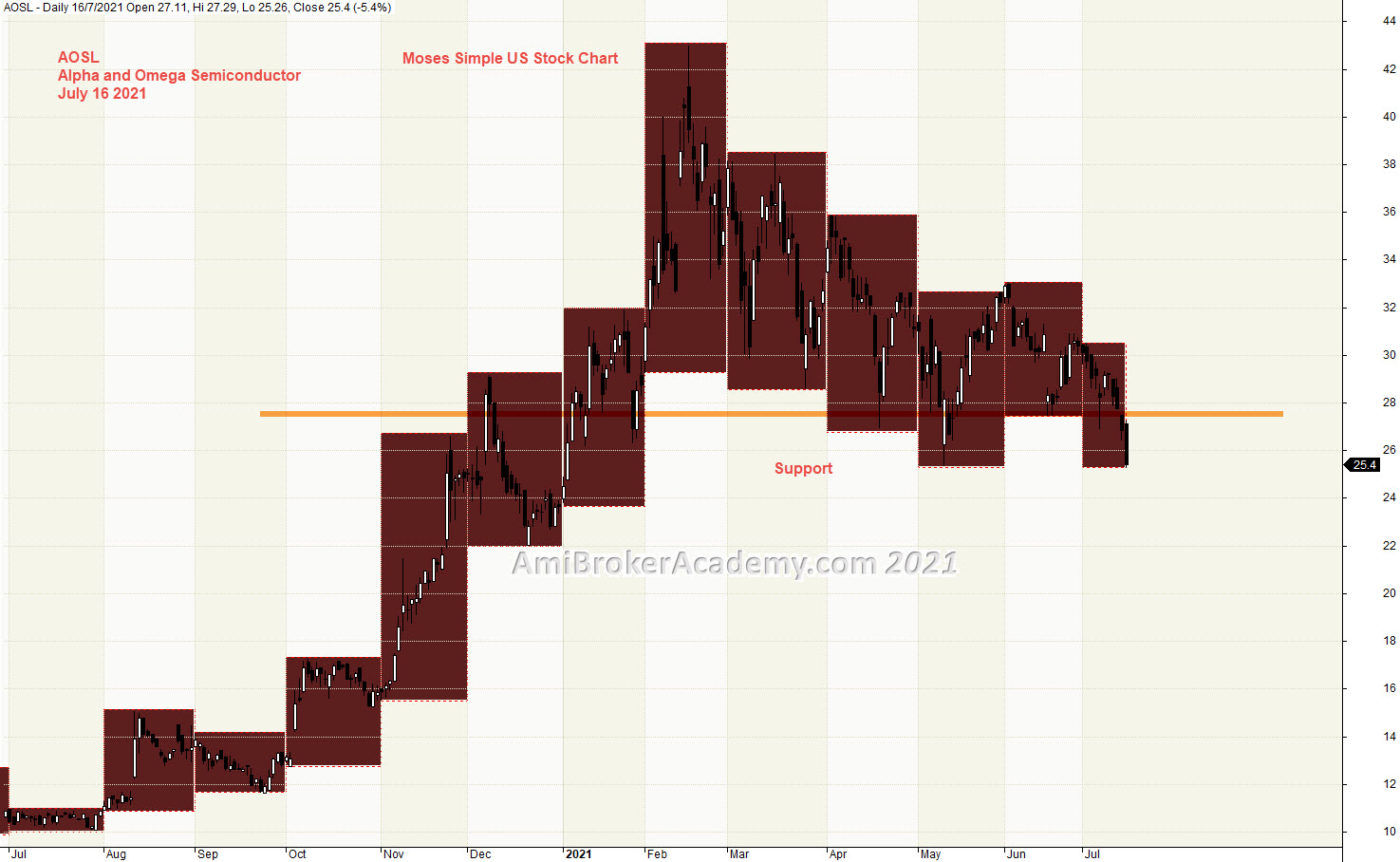
2) Alpha and Omega Semiconductor and Support Resistance
Study Alpha and Omega Semiconductor price action, price action goes from low to high and pullback, from bottom left to top. If we use the month high low to help in finding the support resistance. We will fine a key level, price action has supported by the key level.
Trade what you see. Mange your risk.
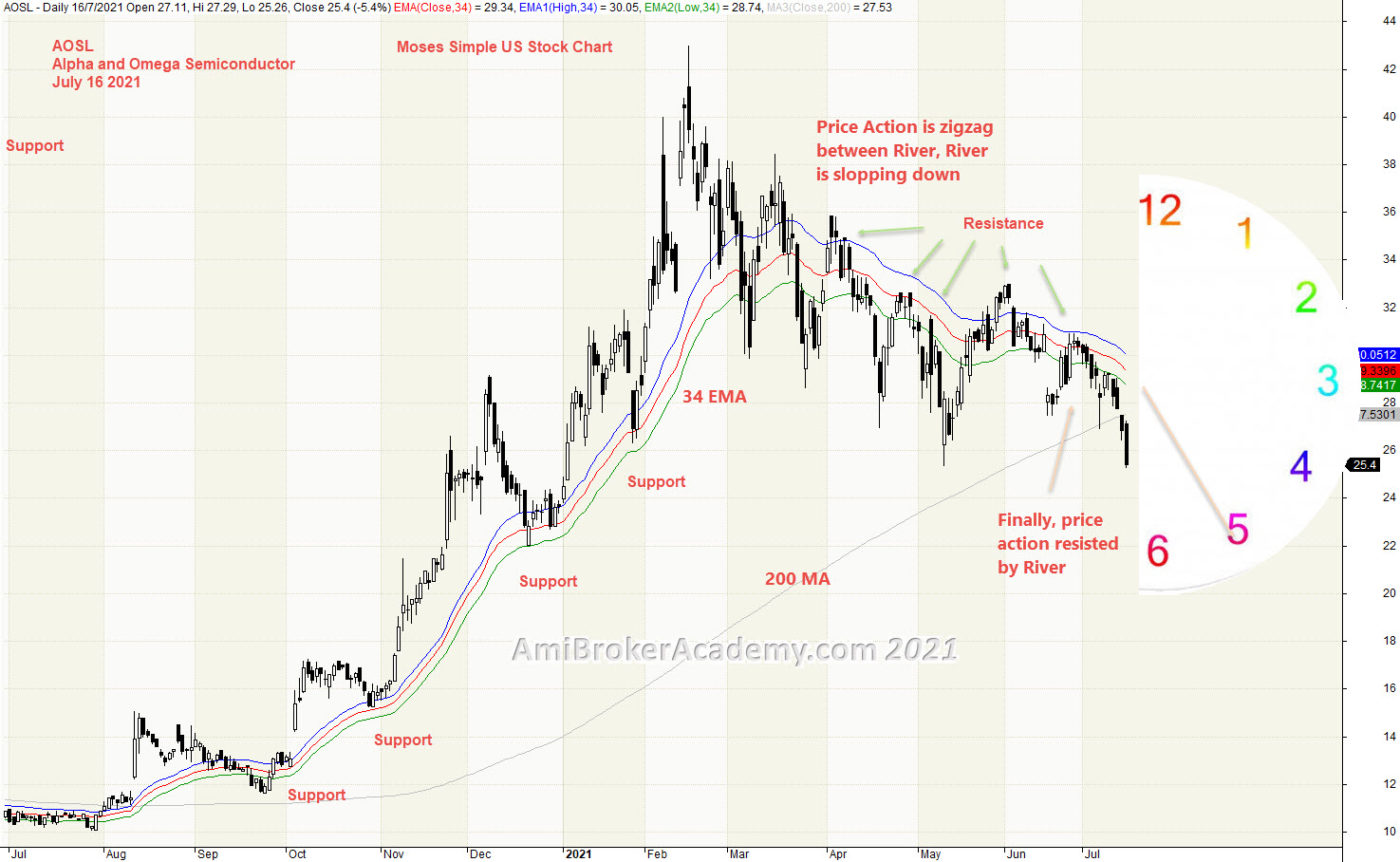
3) Alpha and Omega Semiconductor and River
Price Action is pointing to five o’clock direction, price action is bear bias. See chart, we see the trend is slopping down for its high in February.
Moving Average is a great visual tool. Raghee uses high, low and close of 34 EMA to form a band to determine the wave direction. Price action goes from above 34 EMA and continue to stay above River. But Price Action fail to go higher, price action begin to breakout below the River and stay below. River is now act as resistance.
River is a great support resistance tool too.
Manage your risk.
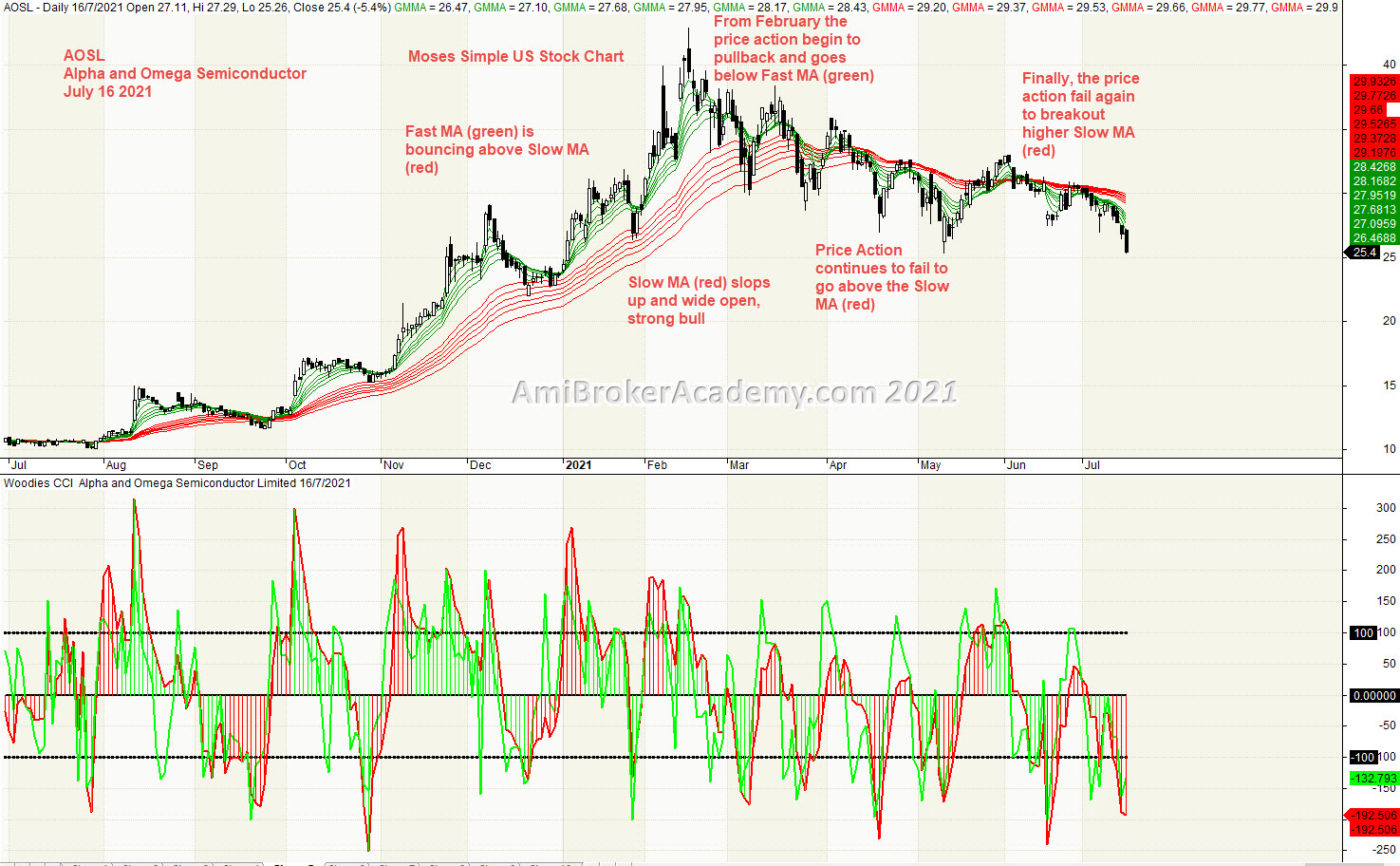
4) Alpha and Omega Semiconductor and GMMA and Woodies CCI
Price Action and Fast MA (green) is above Slow MA (red) until February. Price action begin to cross below Slow MA (red) and stay below.
Trade with eyes open.
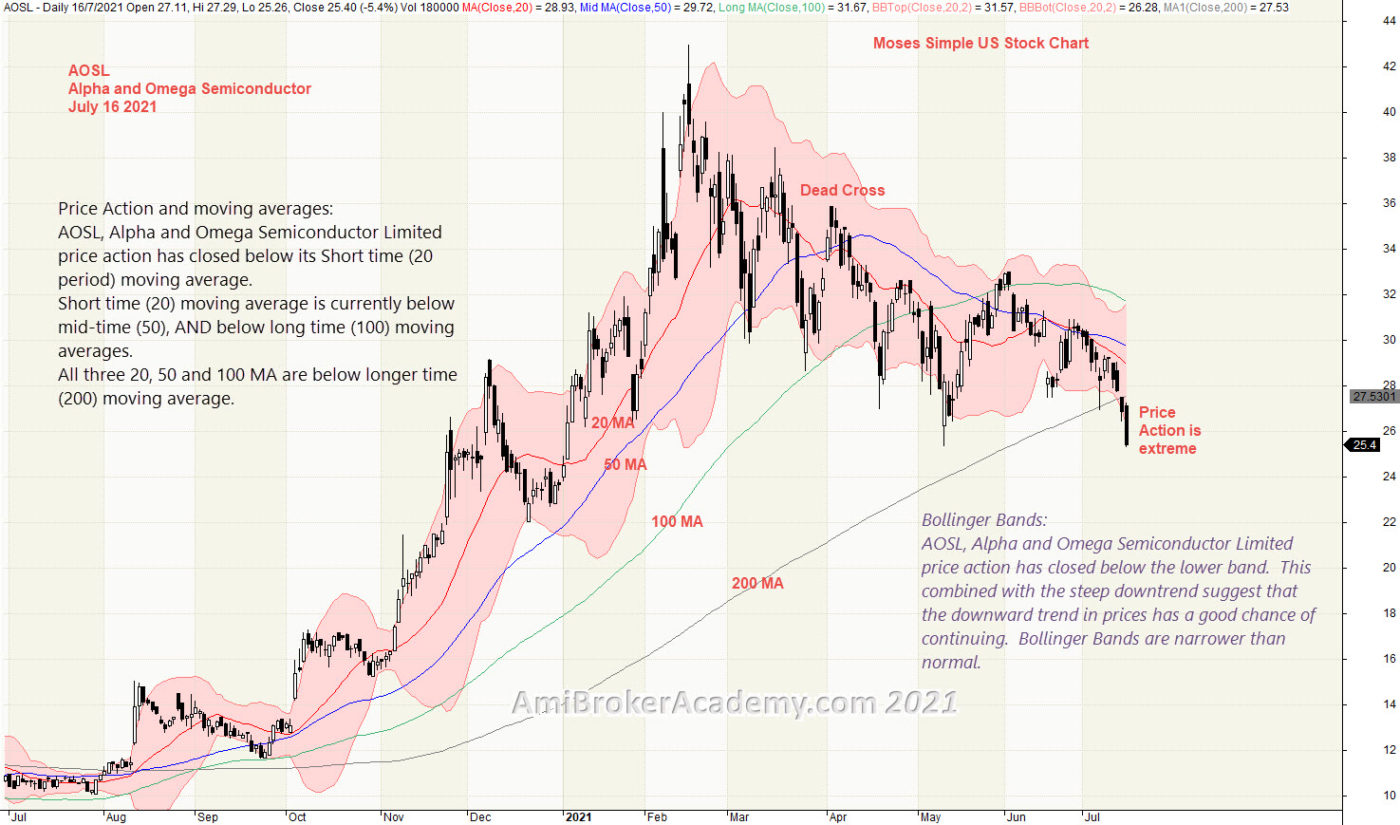
5) Alpha and Omega Semiconductor and Bollinger Bands and Moving Averages
Price Action and Moving Averages:
AOSL, Alpha and Omega Semiconductor price action has closed below its Short time (20 period) moving average.
Short time (20) moving average is currently below mid-time (50), and below long time (100) moving average.
Mange your risk.
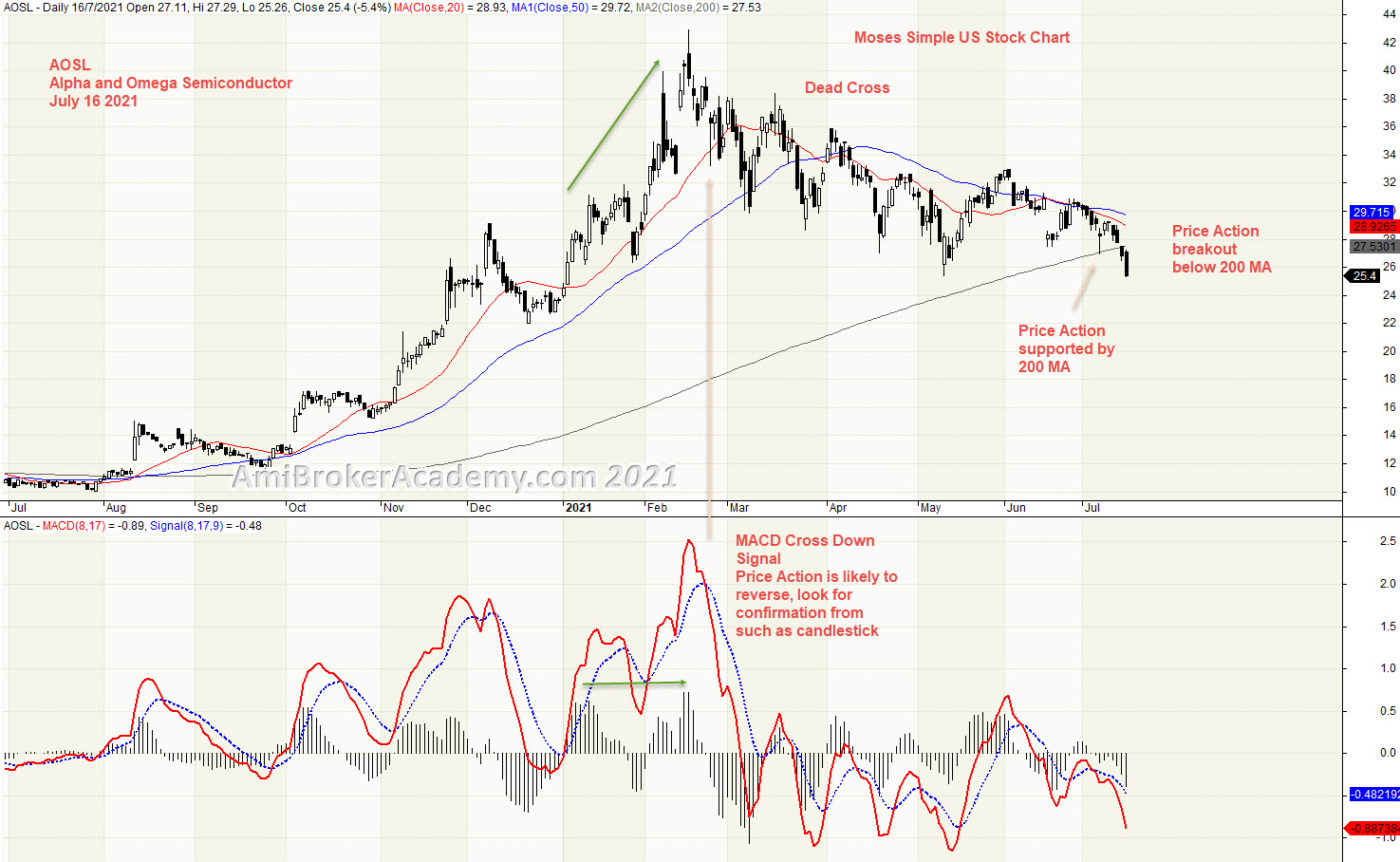
6) Alpha and Omega Semiconductor and MACD
We study price action we see MACD Divergence, price action continues to go higher, but MACD begin to form lower high. So we expect a reversal is going to happen. But everyone by now has learnt that MACD Divergence is like a traffic light, you don’t have to stop at every traffic light. So, be the MACD Divergence.
Trade what you see. We are looking for bear signal, and confirmation. MACD cross signal is a good indication to lookout for.
So, read the information you can get from the chart. You probably notice a MACD cross up signal, this is a signal on price action reversal. Reay to buy.
Remember, we just read what the chart said. Have fun!
But. don’t play play with MACD indicator. Very simple yet powerful.
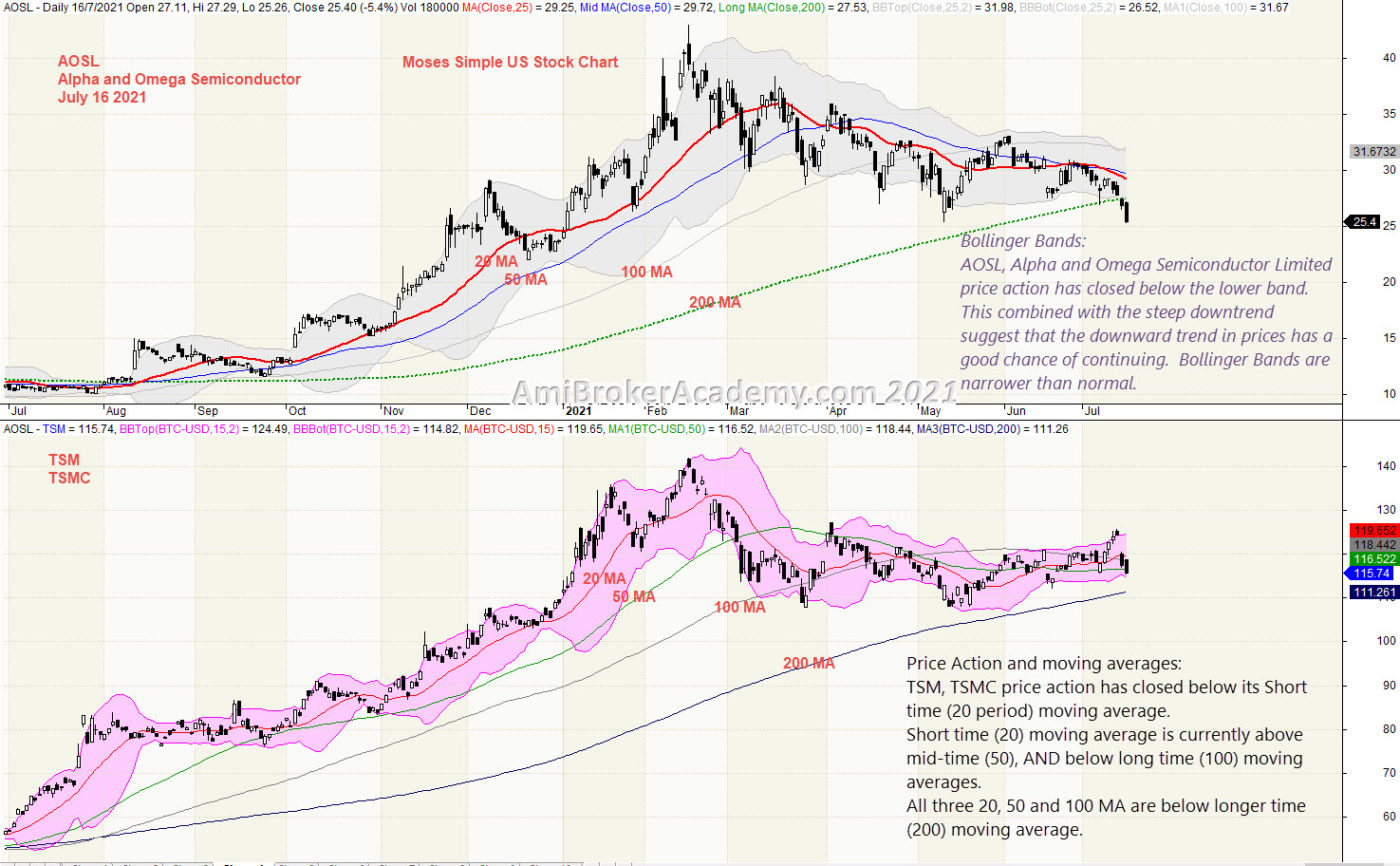
7) Alpha and Omega Semiconductor and TSMC Correlation
We could find some similarity on the bull and bear trend, see chart.
Moses Power Charting
Official AmiBrokerAcademy.com Charting
Disclaimer
The above result is for illustration purpose. It is not meant to be used for buy or sell decision. We do not recommend any particular stocks. If particular stocks of such are mentioned, they are meant as demonstration of Amibroker as a powerful charting software and MACD. Amibroker can program to scan the stocks for buy and sell signals.
These are script generated signals. Not all scan results are shown here. The MACD signal should use with price action. Users must understand what MACD and price action are all about before using them. If necessary you should attend a course to learn more on Technical Analysis (TA) and Moving Average Convergence Divergence, MACD.
Once again, the website does not guarantee any results or investment return based on the information and instruction you have read here. It should be used as learning aids only and if you decide to trade real money, all trading decision should be your own.
We learn from many past and present great traders. Kudo to these master.