15 February, 2019
Welcome to AmiBrokerAcademy.com. We provide US stock analysis for academy learning also.
Think!
^HSI Hong Kong Hang Seng Index Stock Charting
Study Hong Kong Hang Seng Index stock chart.
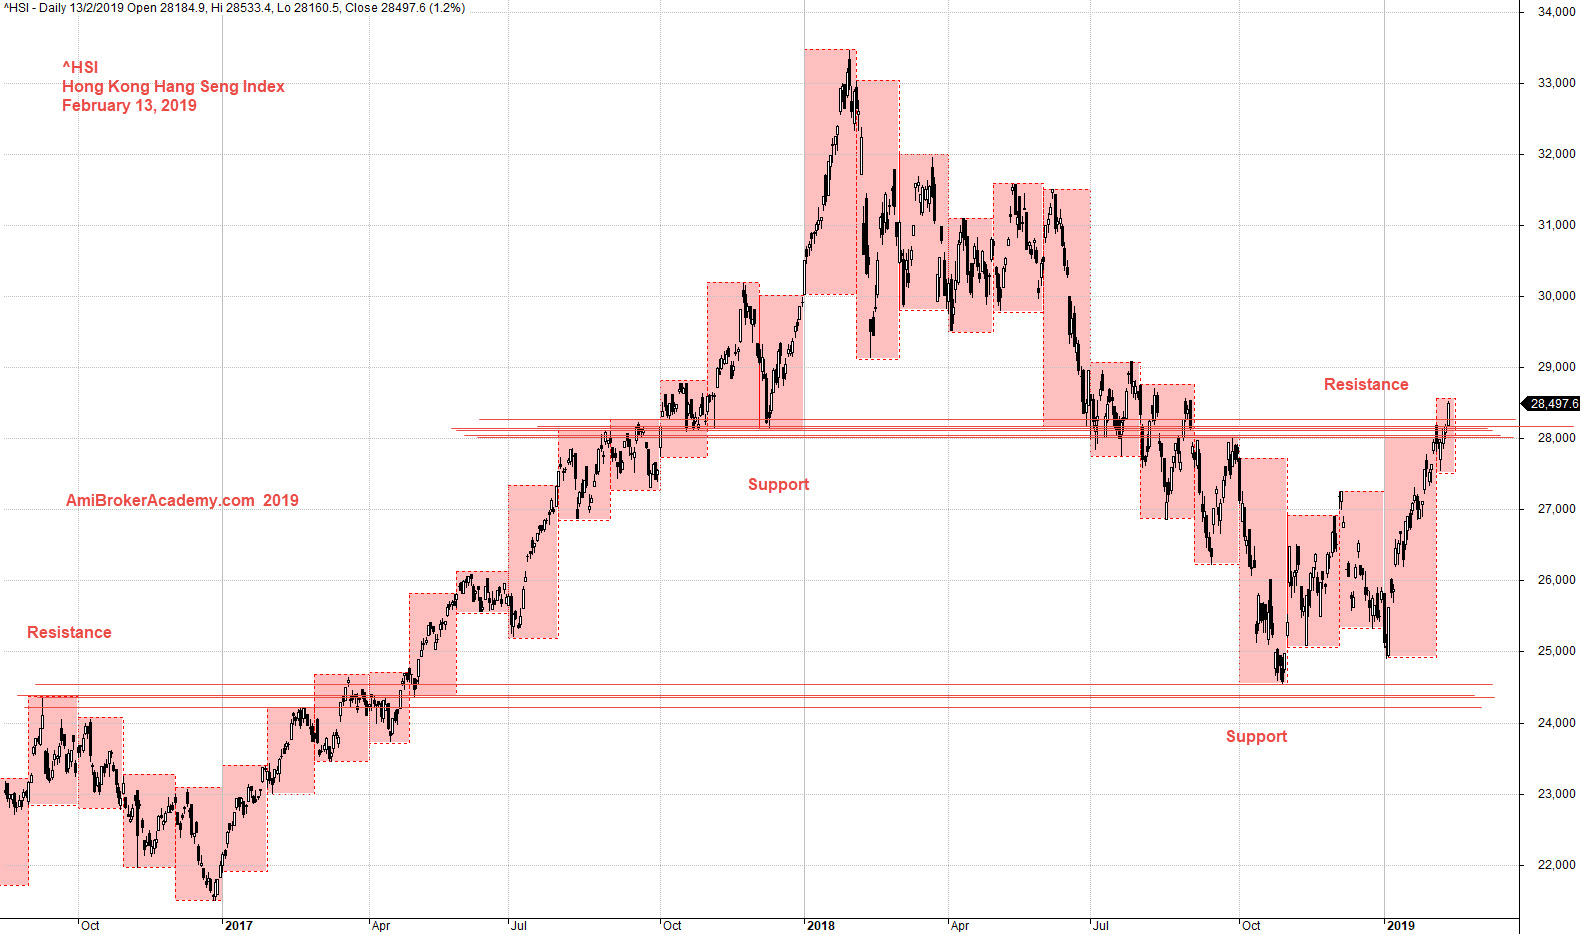
Price action push to cross 33000 level at 2018, thereafter the price action become weaker, the price action begin to drop and fail below 25,000 level. Why? Market react to the trader confident. What traders begin to think the value not there, the price action begin the weaken.
Use box, you could easily see the support and resistance.
Price action trapped between two strong levels. See chart, picture worth a thousand words.
Trade with eyes open.
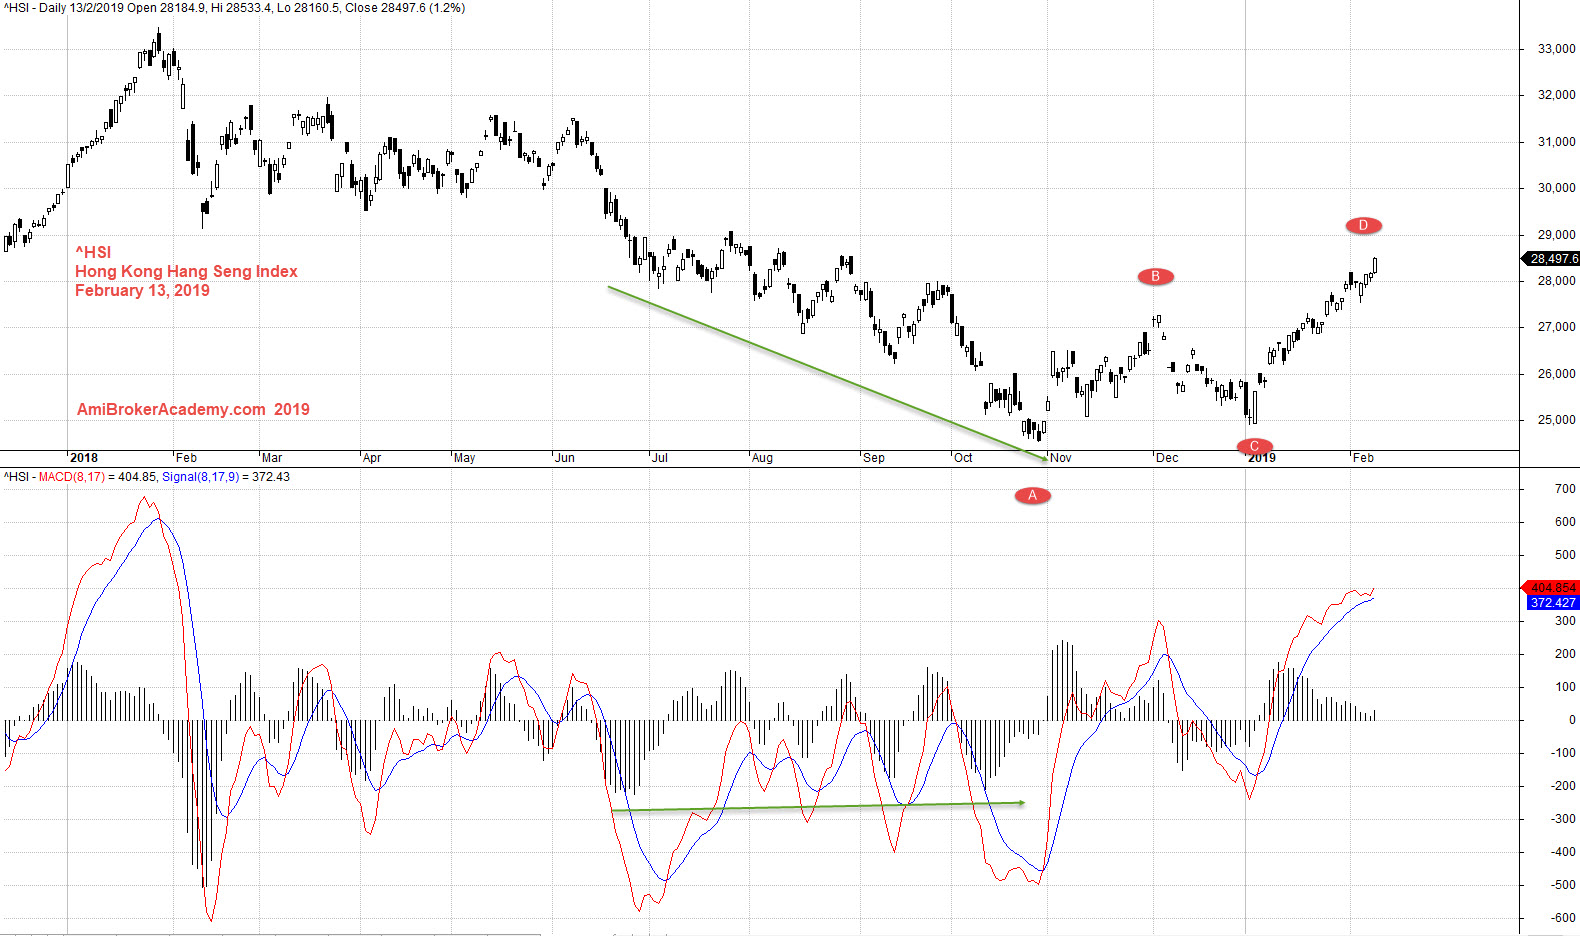
Add MACD indicator, see chart, a positive divergence. Price action seem has a reversal ABCD pattern.
Moses Stock Analysis
AmiBrokerAcademy.com
Disclaimer
The above result is for illustration purpose. It is not meant to be used for buy or sell decision. We do not recommend any particular stocks. If particular stocks of such are mentioned, they are meant as demonstration of Amibroker as a powerful charting software and MACD. Amibroker can program to scan the stocks for buy and sell signals.
These are script generated signals. Not all scan results are shown here. The MACD signal should use with price action. Users must understand what MACD and price action are all about before using them. If necessary you should attend a course to learn more on Technical Analysis (TA) and Moving Average Convergence Divergence, MACD.
Once again, the website does not guarantee any results or investment return based on the information and instruction you have read here. It should be used as learning aids only and if you decide to trade real money, all trading decision should be your own.