July 19, 2014
Moses’ Stock Column
Picture (Chart) Worth a Thousand Words!
Welcome to Moses’ Stock Thought and Notes!
Let study Biosensors International Group Ltd B20. Biosensors was on uptrend for 2011, thereafter B20 had declined, downtrend mid August 2013. Biosensors has gone ranging since then. The price action has range between 0.78 to 1.04.
See the chart for details. Chart tells a thousand words!
Biosensors Daily Chart July 18, 2014
Remember, unless there is an external “force” the trend will continue. What can be the “force” to let the price action change direction, either up or down – to break out from the ranging.
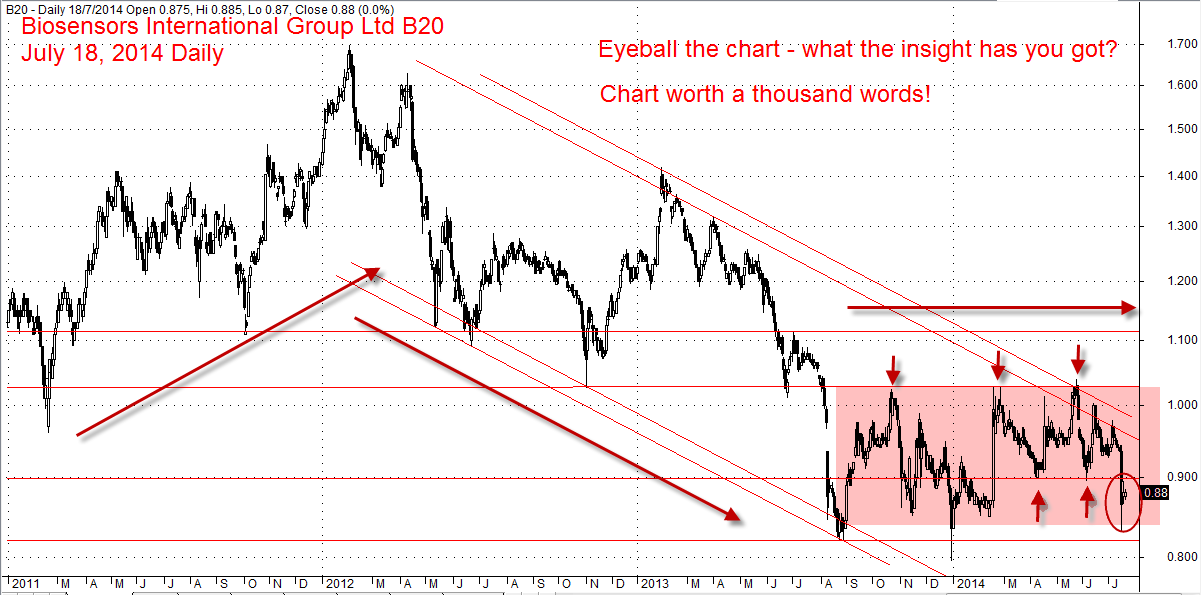
Biosensors International Group, B20 July 18 Daily Chart
.
Thanks for visiting the site, AmiBrokerAcademy.com.
Moses
DISCLAIMER
Information provided here is of the nature of a general comment only and no intend to be specific for trading advice. It has prepared without regard to any particular investment objectives, financial situation or needs. Information should not be considered as an offer or enticement to buy, sell or trade.
You should seek advice from your broker, or licensed investment advisor, before taking any action.
Once again, the website does not guarantee any results or investment return based on the information and instruction you have read here. It should be used as learning aids only and if you decide to trade real money, all trading decision should be your own.