July 19, 2014
Welcome to Moses’ Stock Analysis and Review Column
Read other posting on Straits Times Index, July 14 to July 18, 2014.
Straits Times Index, STI, a window into Singapore economy, let’s review how Straits Times Index performed last week, from July 14 to July 18, 2014. Straits Times Index has been struggled to bit the resistance of 3320 points since end May 2014. This is one of the significant levels for STI, if you look left (back) you will find this was a great level in 2013 between February to April too.
Chart tells (worth) a thousand words, see the following charts for details.
July 14, 2014 Straits Times Index, Four (4) Years STI Daily Chart
Many ugly bullish Head and Shoulders chart patterns. Is it forming a bearish Head and Shoulders? Only till the left Shoulder has completed otherwise is only a possibility.
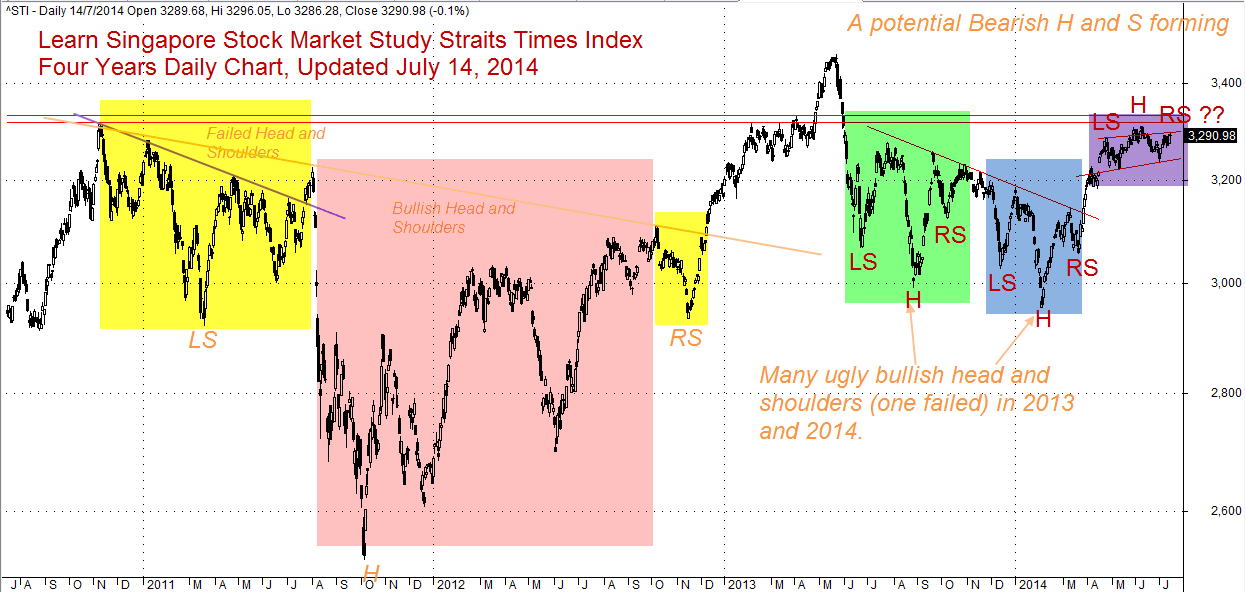
Four (4) Years Data Straits Times Index Daily Chart as at July 14, 2014
July 16, 2004 Straits Times Index, STI 16 months Daily Chart
Can you see a potential bullish flag forming? See the pink area.
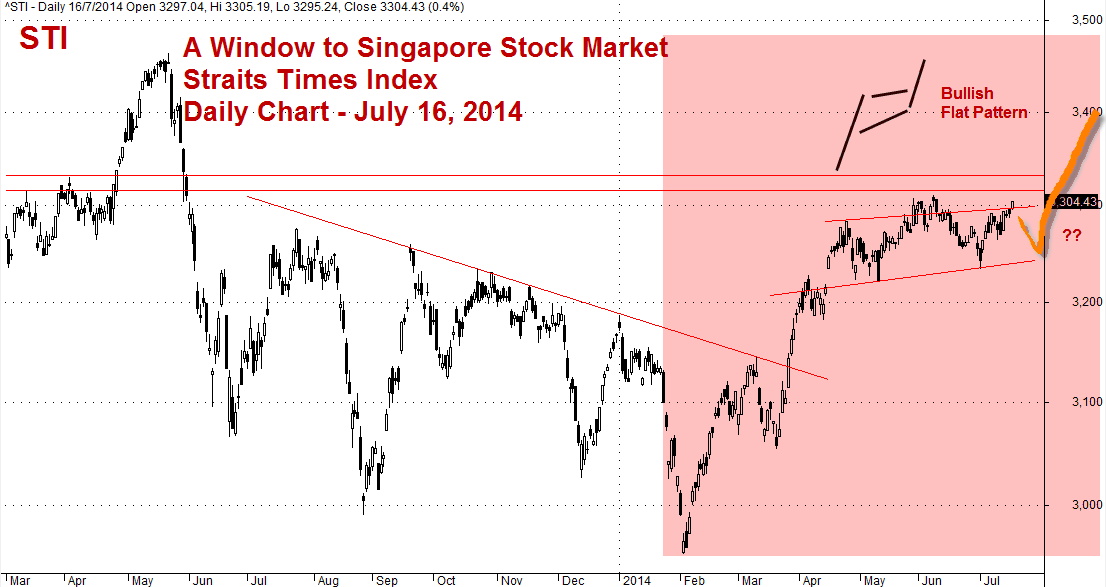
Sixteen (16) Months Straits Times Index Data Daily Chart July 16, 2014
July 16, 2014 Straits Times Index Daily Chart
Still waiting the completing of Head and Shoulders. Note, only the pattern is completed otherwise it is only a possibility.
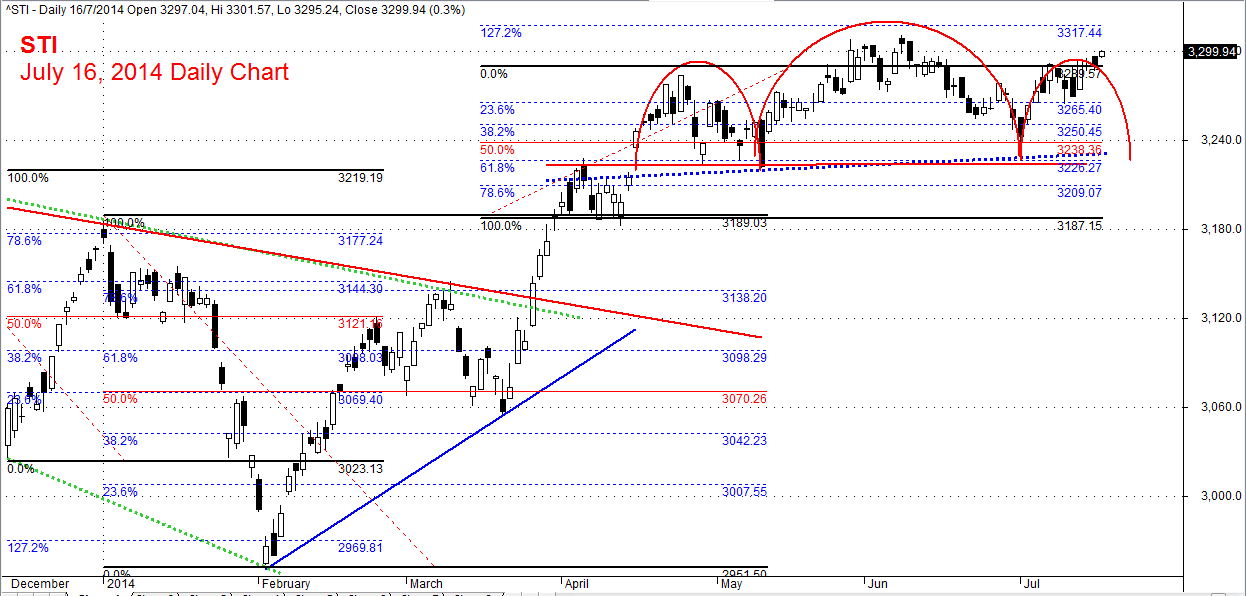
Straits Times Index, STI July 16, 2014 Daily Chart
July 17, 2014 Straits Times Index, STI Weekly Chart After World Great Recession 2007-2008
Ugly Bearish Triple Tops? Or Bullish AB = CD chart pattern? Will see.
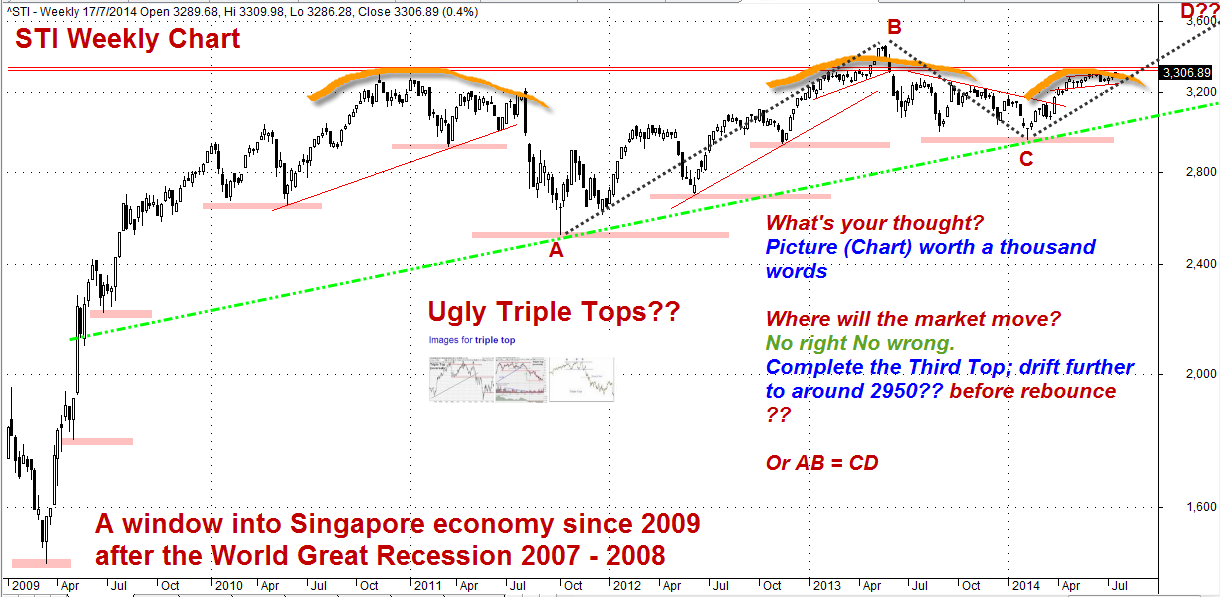
Straits Times Index, STI Weekly Chart after Great World Recession 2007 – 2008
July 18, 2014 Straits Times Index, STI Daily Chart
If the stocks represent the Singapore economy, looks like the worst has over? February? However, there are five more months to go before 2014 is over. Will see.
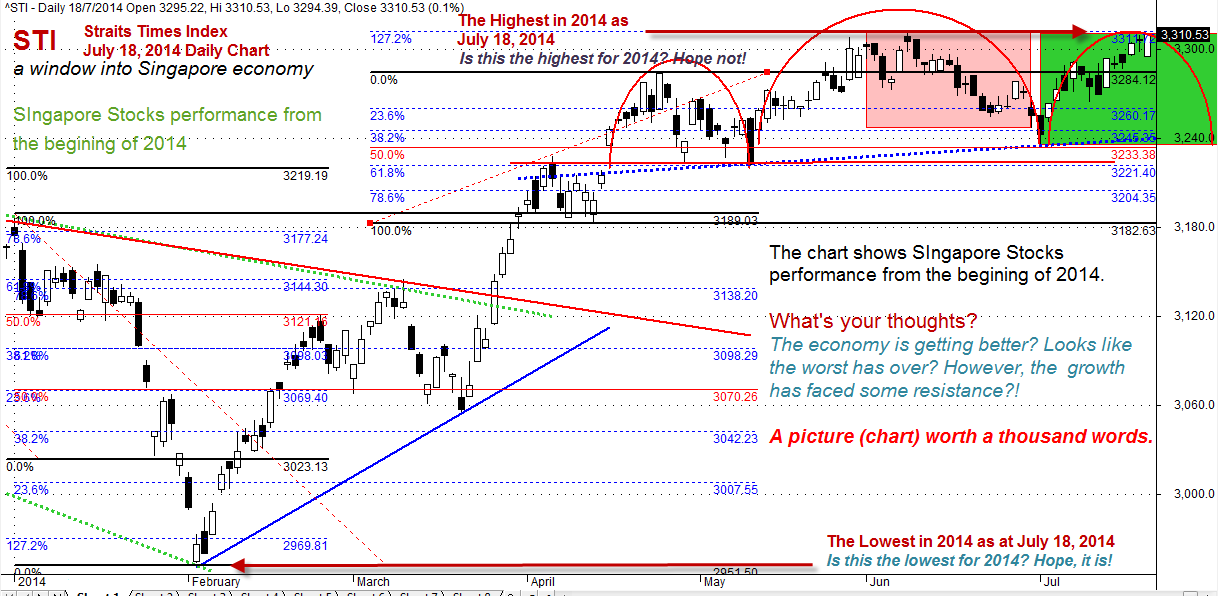
Straits Times Index, STI Daily Chart from Jan to Jul 2014
July 18, 2014 Straits Times Index, STI Daily Chart
July 18, the market closed high. This is highest point for 2014 to-date. Will the market can continue to push higher. However, many of indexes for the Singapore economy were not good.
May be should not worry, the year is not over or near over yet. There are five more to come.
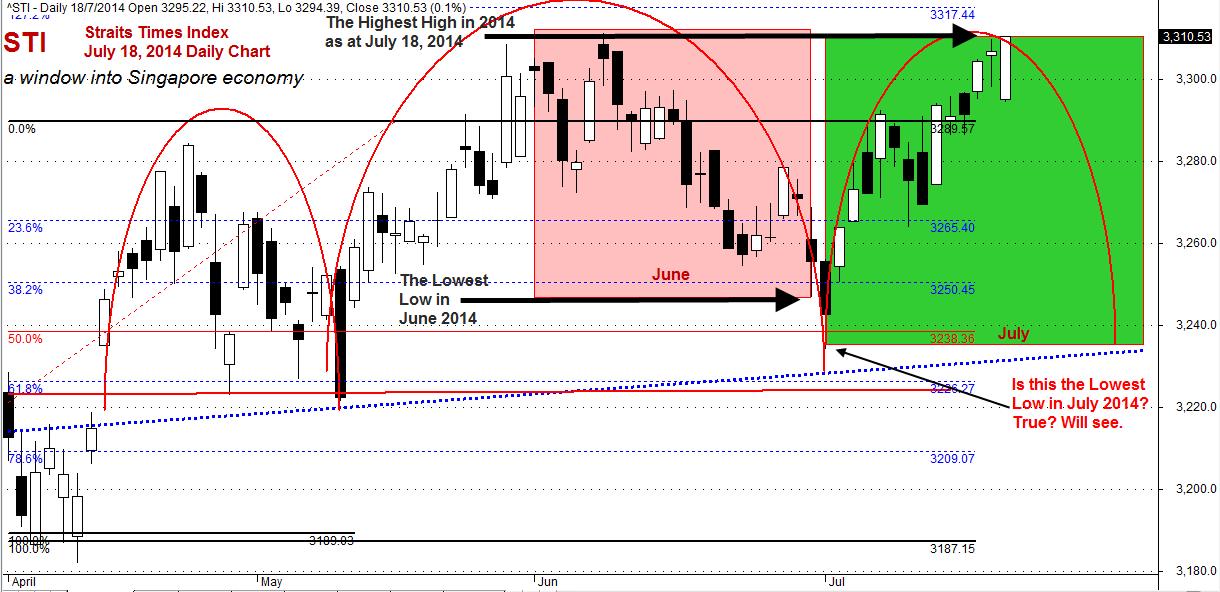
High and Low of June 2014. The High for 2014, July 18 Straits Times Index Daily Chart
Thanks for visiting the site, AmiBrokerAcademy.com.
Moses
DISCLAIMER
Information provided here is of the nature of a general comment only and no intend to be specific for trading advice. It has prepared without regard to any particular investment objectives, financial situation or needs. Information should not be considered as an offer or enticement to buy, sell or trade.
You should seek advice from your broker, or licensed investment advisor, before taking any action.
Once again, the website does not guarantee any results or investment return based on the information and instruction you have read here. It should be used as learning aids only and if you decide to trade real money, all trading decision should be your own.