March 30, 2018
Black Monday October 19, 1987 – Dow Jones Industrial Average Index
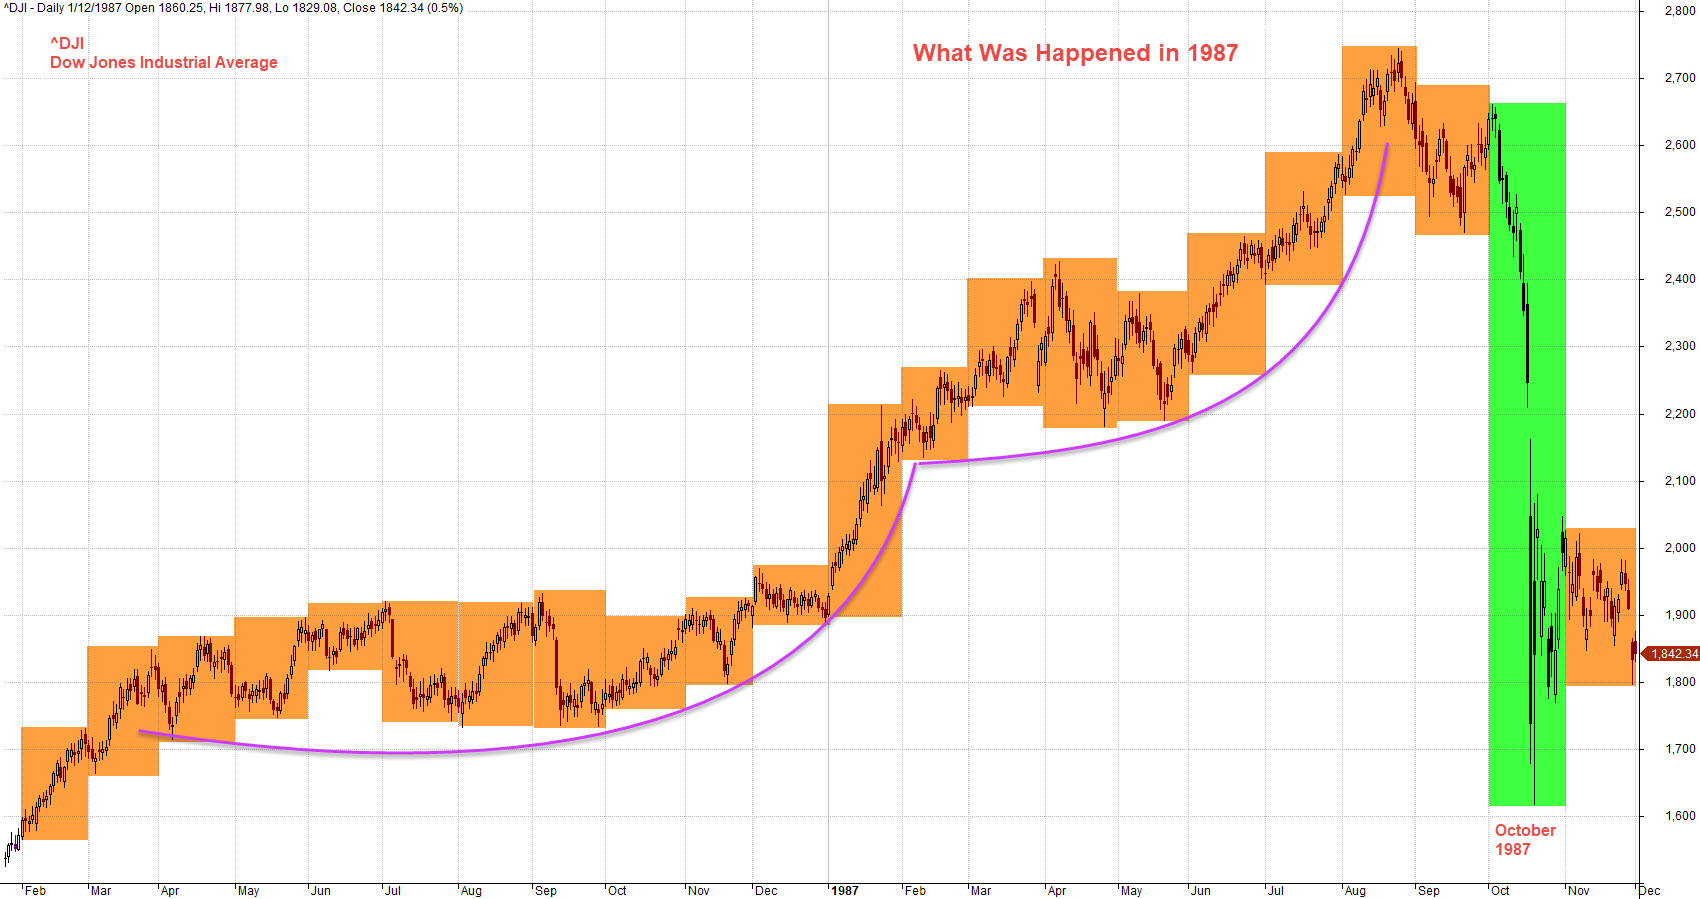
Thirty years ago, on October 19, 1987 the stock markets around the world crashed. The following chart was what happen to US Dow Jones Industrial Average Index. Picture worth a thousand words, see chart for more.
US Stock Chart Analysis
^DJI Dow Jones Industrial Average Charting – Black Monday Crashed
As a trader, have you heard of Black Monday? Black Monday in the financial market, it refers to October 19, 1987.
Thirty years ago, on October 19, 1987 the stock markets around the world crashed. The crash started from East Hong Kong spread to west Europe and ended in United State. The day, October 19, 1987 has now been named Black Monday.
You as a trader, better know the risk and study the pattern of the crashed. As you know well, all set up can fail. So if the crashed do not happen even the pattern looks similar it is great. No fear, no panic. Trade with eyes open and manage your risk.
Market Remember The History
In finance, we know the market always remember the history. What can you learn from the lesson? Manage your risk.
Manage your risk. Avoid to buy high and sell higher.
Powerful Chart Software – AmiBroker
The following chart is produced using AmiBroker charting software. It is a powerful chart software. Anything, finance ticket you could download from Yahoo! Finance you could plot them, those you are interested all in a chart, so you could analyse them. The further you can download from Yahoo! Finance is 1970. Enjoy your learning.
History on October 1987 Dow Jones Industrial Average Index Charting
Moses US Stock Chart Analysis
AmiBrokerAcademy.com
Disclaimer
The above result is for illustration purpose. It is not meant to be used for buy or sell decision. We do not recommend any particular stocks. If particular stocks of such are mentioned, they are meant as demonstration of Amibroker as a powerful charting software and MACD. Amibroker can program to scan the stocks for buy and sell signals.
These are script generated signals. Not all scan results are shown here. The MACD signal should use with price action. Users must understand what MACD and price action are all about before using them. If necessary you should attend a course to learn more on Technical Analysis (TA) and Moving Average Convergence Divergence, MACD.
Once again, the website does not guarantee any results or investment return based on the information and instruction you have read here. It should be used as learning aids only and if you decide to trade real money, all trading decision should be your own.