10 September 2020
Welcome to AmiBroker Academy, Moses Stock Charting. Thanks for visiting the site.
We use powerful AmiBroker charting software tool for our chart and stock scan.
Trade with eyes open. Manage your risk. Have fun!
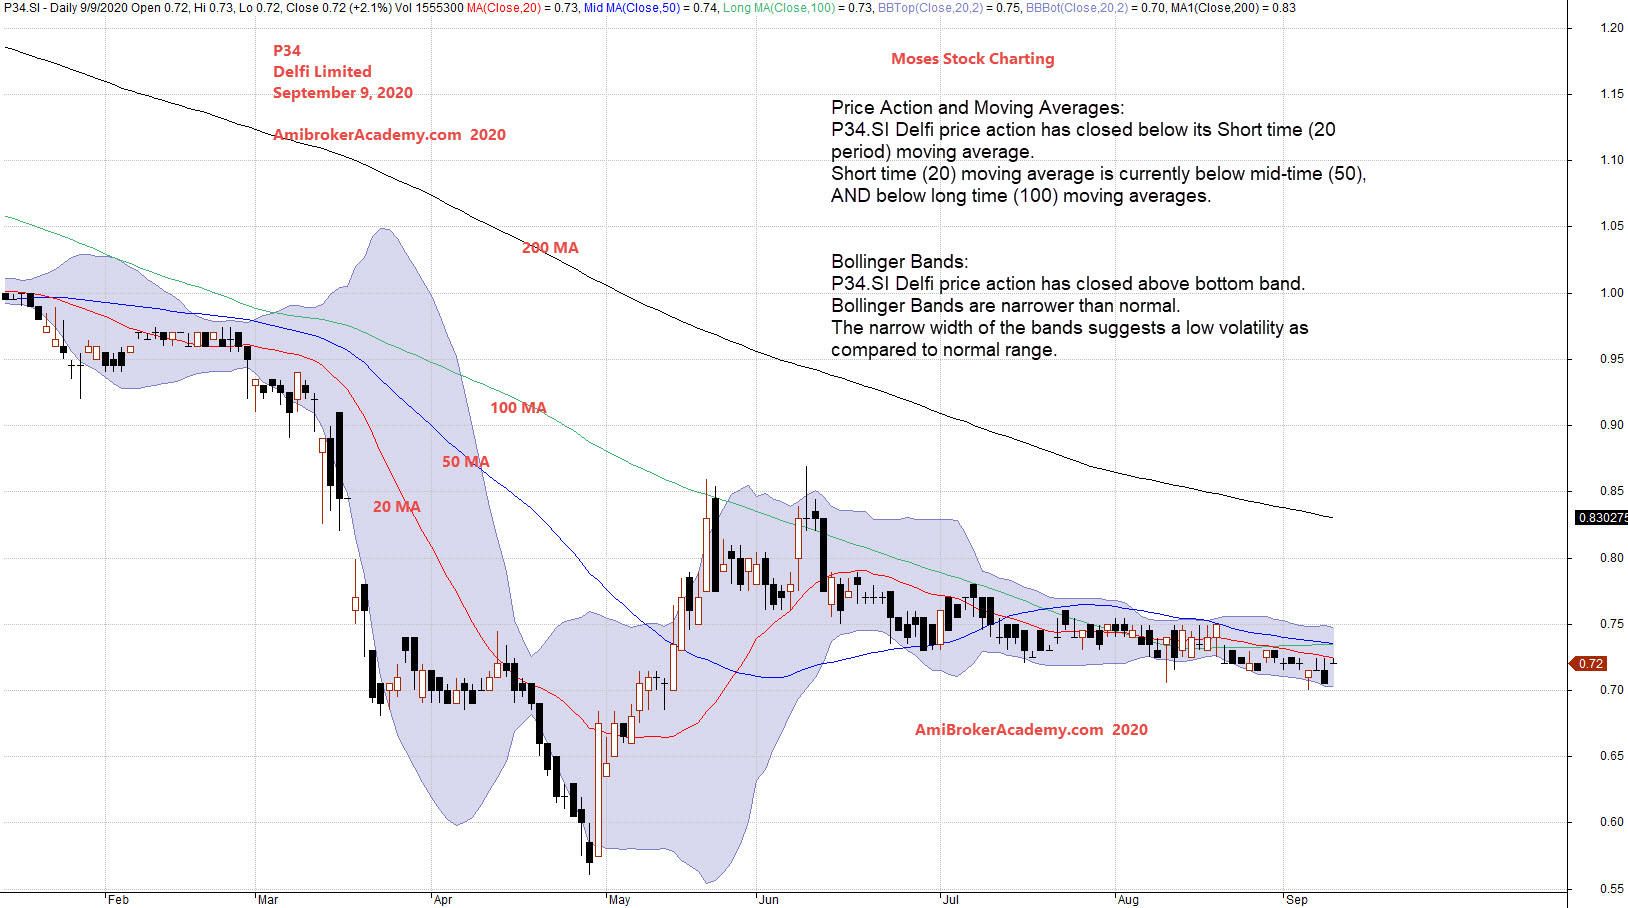
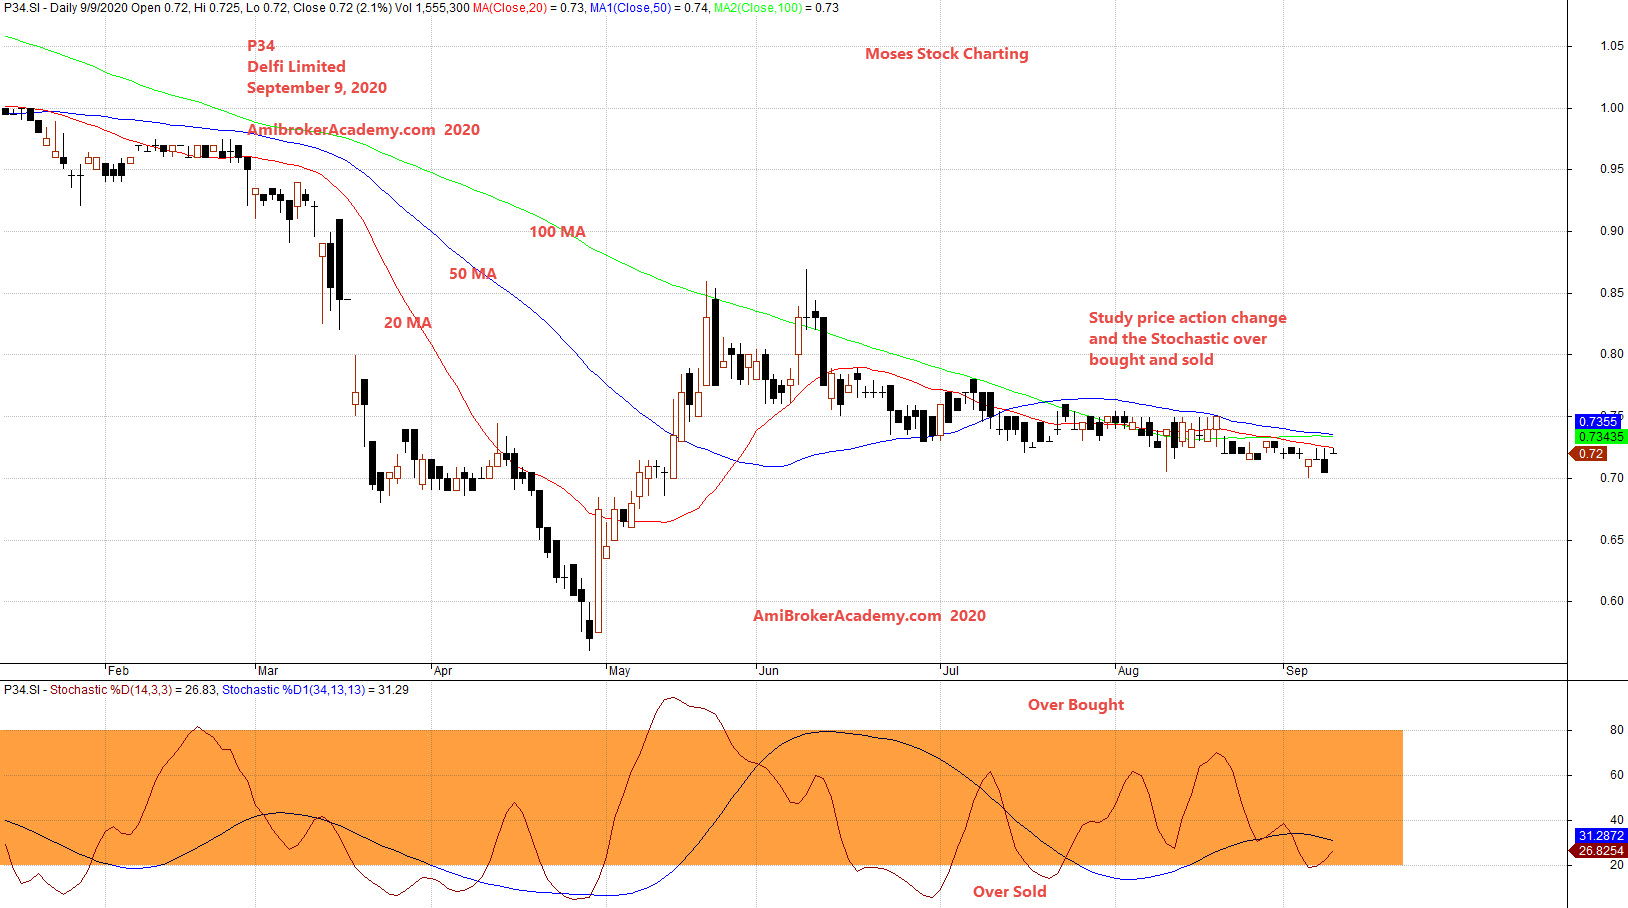
P34.SI | Delfi Stock Charting
Study Delfi Stock Charting and Price Action.
Picture worth a thousand words. See chart.
Trade with eyes open. Mange your risk.
We use indicator, but we read chart on their price action. Don’t miss taken.
Price Action
Price Action moves in zigzag manner.
Support Resistance or Trendline
Buy Support Sell Resistance.
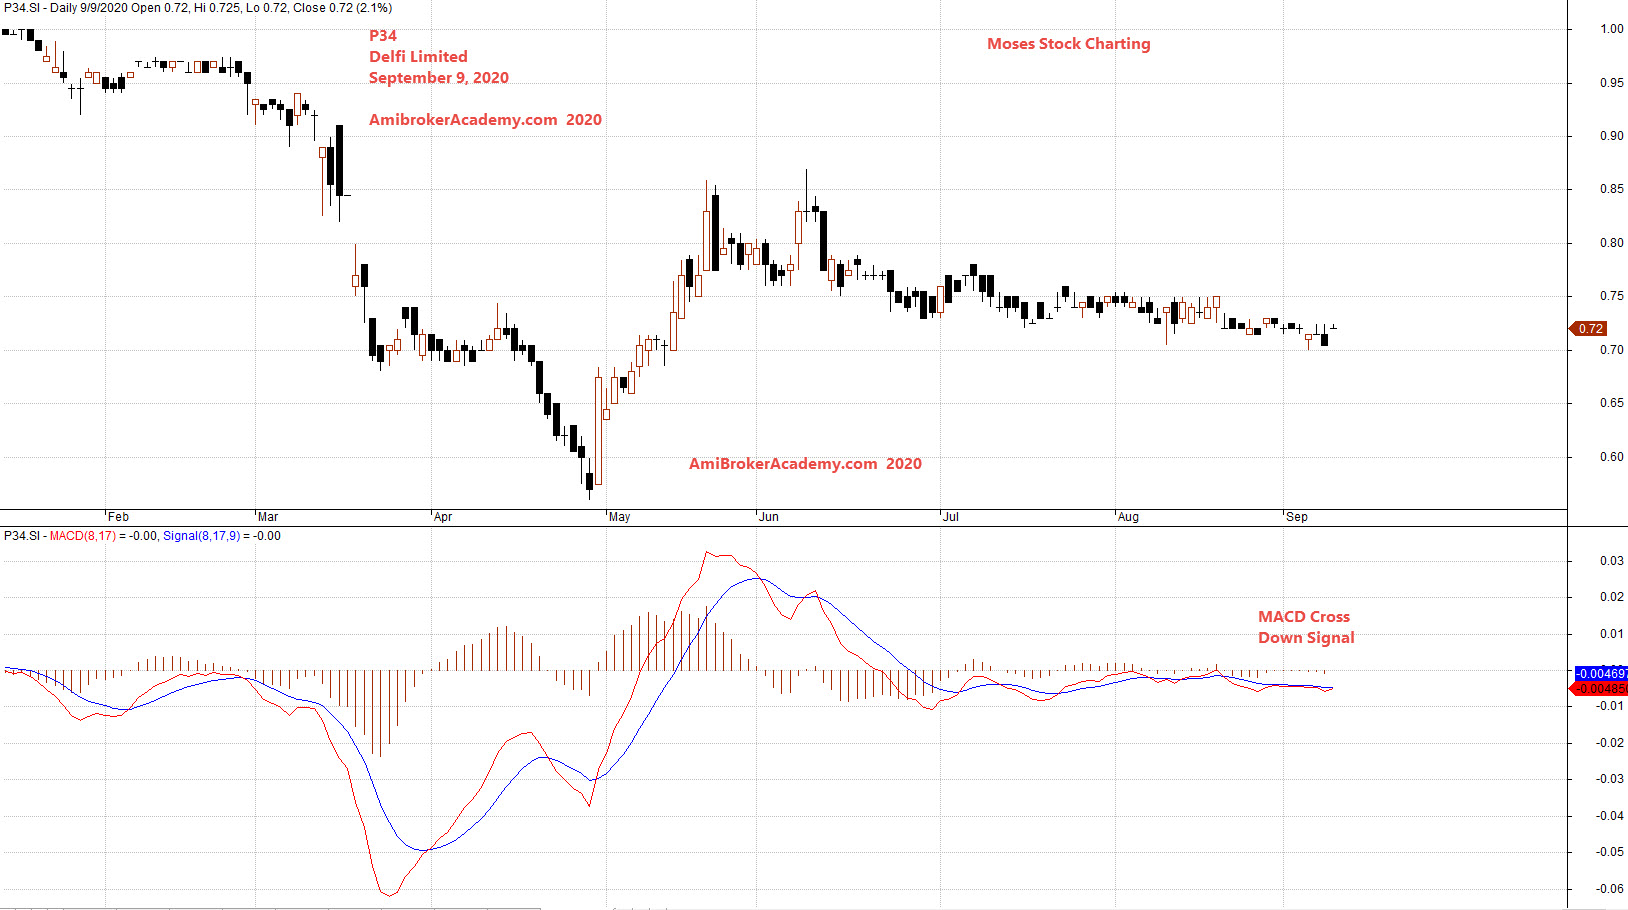
MACD
River
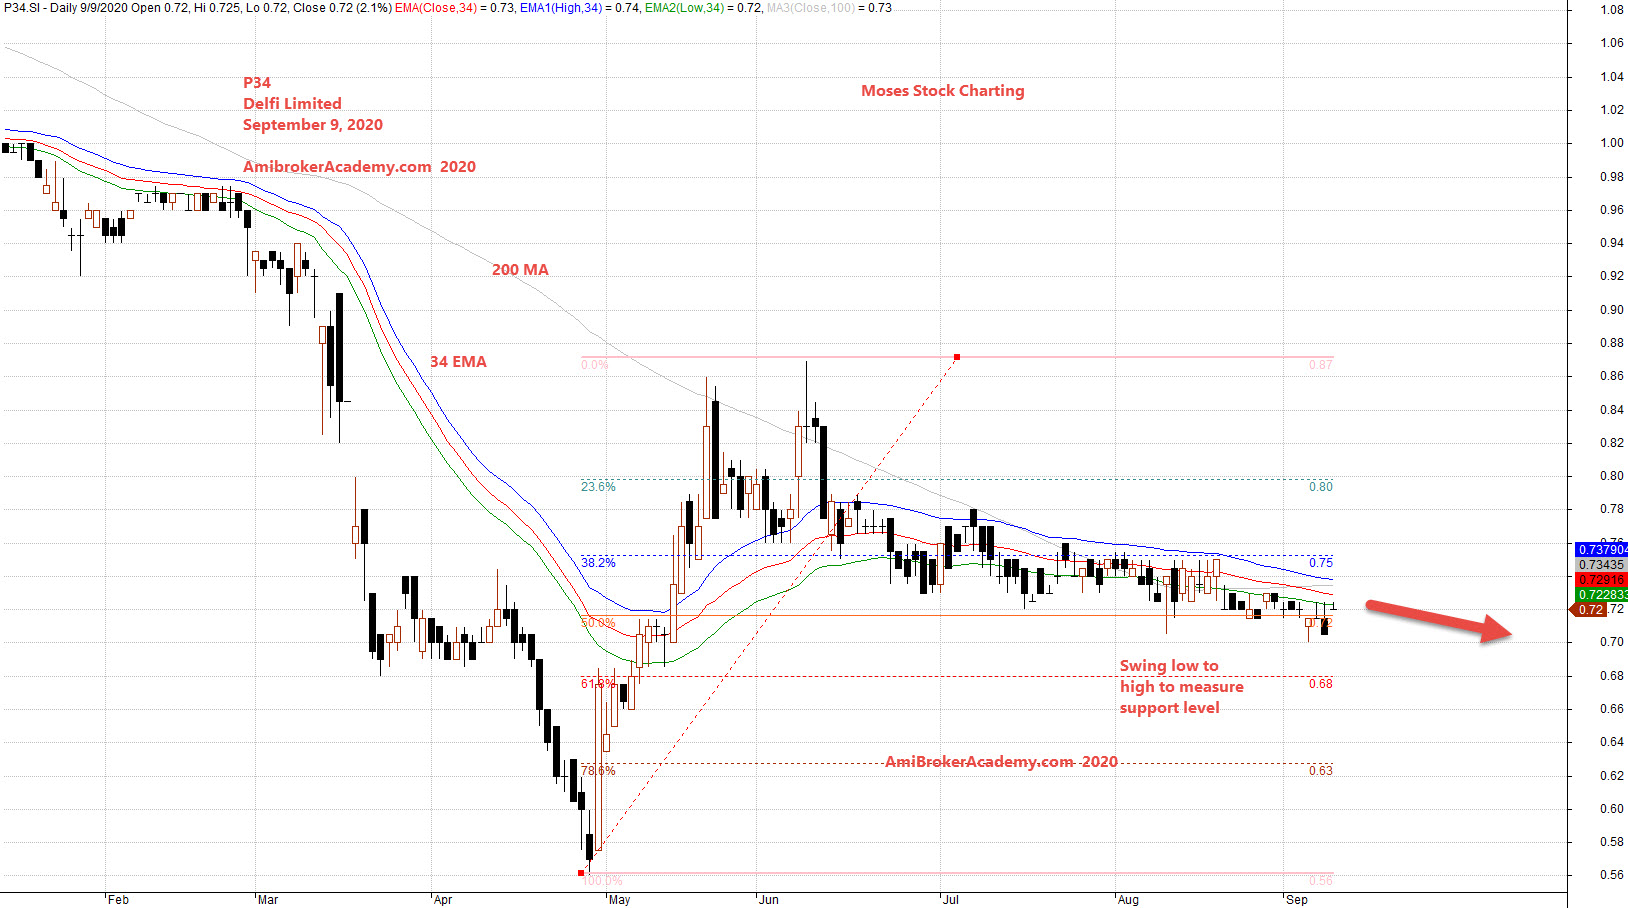
Fibonacci swing low to high.
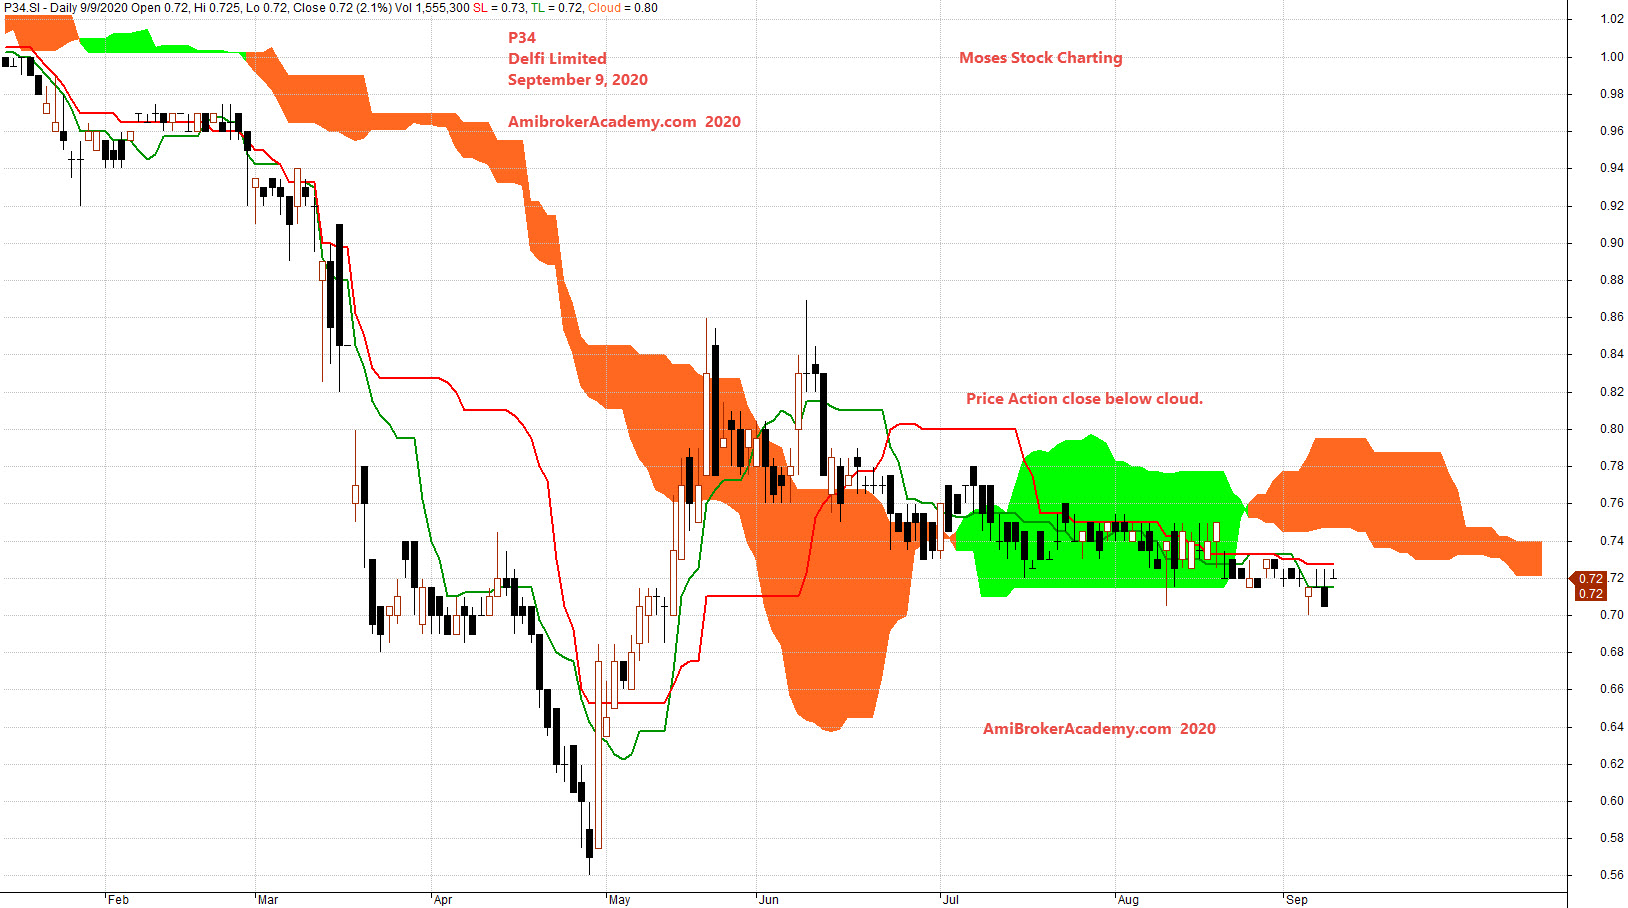
Ichimoku Cloud
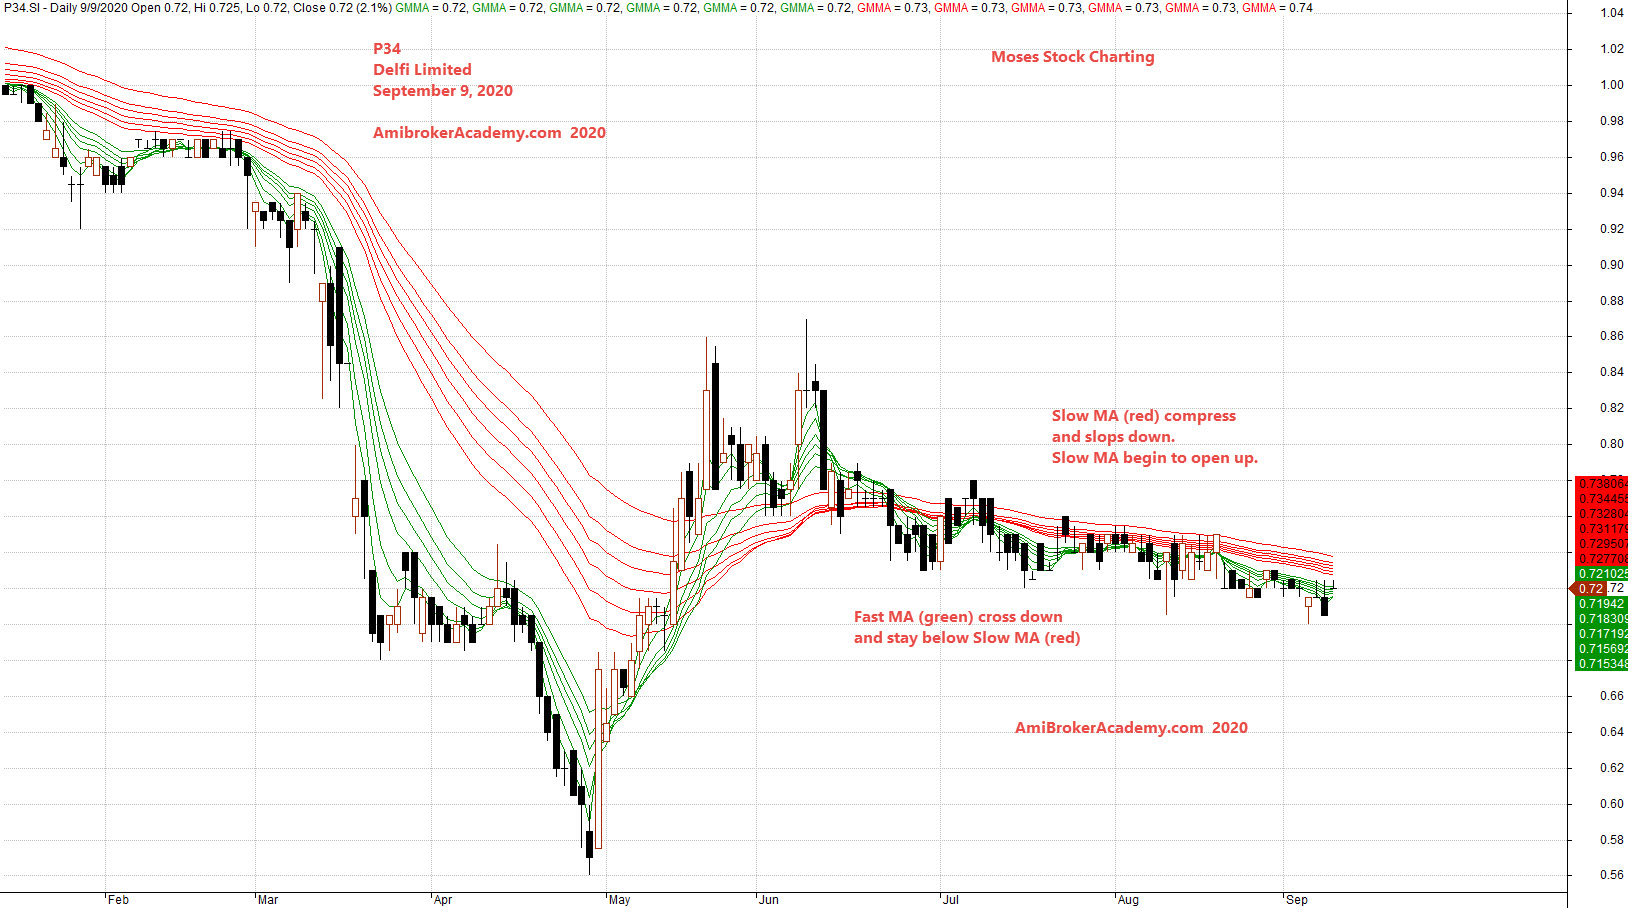
GMMA
Bollinger Bands and Moving Averages
Stochastic
Moses Stock Observation
AmiBrokerAcademy.com
Disclaimer
The above result is for illustration purpose. It is not meant to be used for buy or sell decision. We do not recommend any particular stocks. If particular stocks of such are mentioned, they are meant as demonstration of Amibroker as a powerful charting software and MACD. Amibroker can program to scan the stocks for buy and sell signals.
These are script generated signals. Not all scan results are shown here. The MACD signal should use with price action. Users must understand what MACD and price action are all about before using them. If necessary you should attend a course to learn more on Technical Analysis (TA) and Moving Average Convergence Divergence, MACD.
Once again, the website does not guarantee any results or investment return based on the information and instruction you have read here. It should be used as learning aids only and if you decide to trade real money, all trading decision should be your own.