March 28, 2018
Hong Kong Stock Chart Analysis
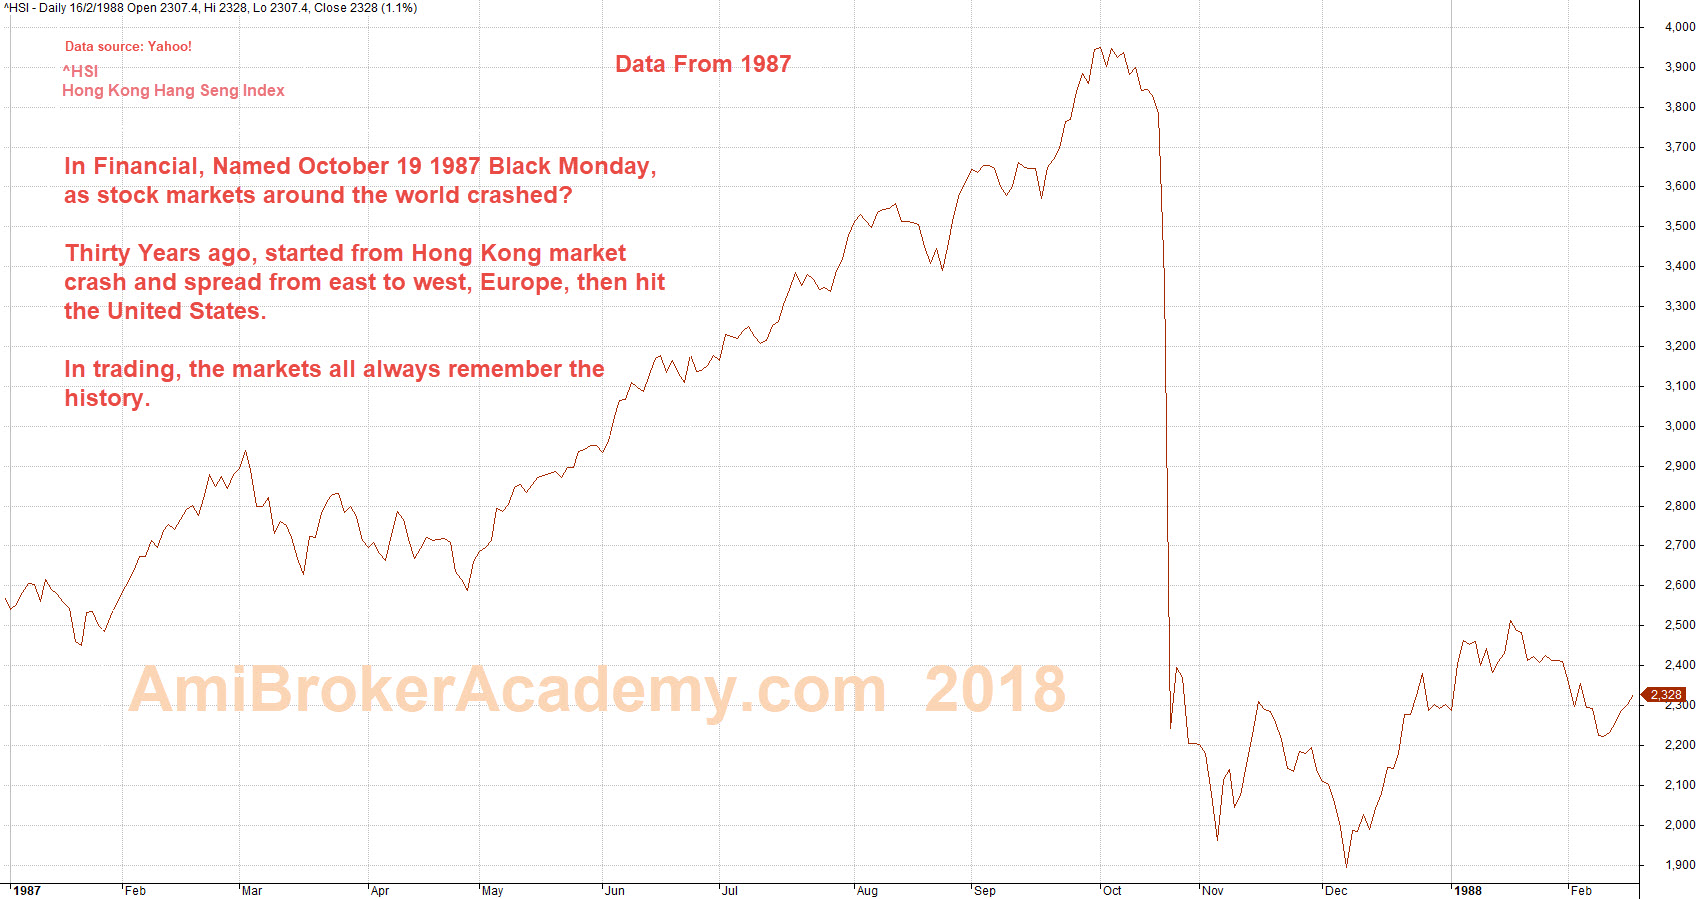
Black Monday October 19, 1987
Thirty years ago, on October 19, 1987 the stock markets around the world crashed. In financial, named the day October 19, 1987 as Black Monday. The crash started from East Hong Kong spread to west Europe and ended in United State.
In finance, the market always remember the history. What can you learn from the lesson? Manage your risk. See the market today, the price action just continue to form higher high, until beginning of this year the market stop going any higher and start to forms lower high. The market confident begin to weaken. There are too many reason for the market to feel uncomfortable. Many of the traders and investors start to sell off to cash in.
^HSI Hong Kong Hang Seng Index Charting – Study the Black Monday October 19, 1987
Think Think Got More Things
Can the history repeat itself? Sure it can.
Will it begin from the east? Sure it can.
Manage your risk, this is the only suggestion for you. Paper money is good, only until the cash in your pocket otherwise it is still not money. See recent incident on Facebook Inc stock price, how much money has vaporize. Was the FB problem new? Not, do not think so. Many years the question already raise. But the market just be happy, now the market not happy.
The crash can come from many reason. No one will know which is a better reason to bring the market down. Again, manage your risk.
Note:
Sorry, we are not saying the market will crash. But we look left and plan right. We just share with your the chart on the 1987. With a powerful chart software like AmiBroker as long as your have the data you can plot the chart for your own analysis. It is also the greatness of Yahoo!, the data come from Yahoo!
Powerful Chart Software – AmiBroker
The following chart is produced using AmiBroker charting software. It is a powerful chart software. Anything, finance ticket you could download from Yahoo! Finance you could plot them, those you are interested all in a chart, so you could analyse them.
Thirty Years ago, Hong Kong Hang Seng Index and Lesson From October 19 1987
Moses China Stock Chart Analysis
AmiBrokerAcademy.com
Disclaimer
The above result is for illustration purpose. It is not meant to be used for buy or sell decision. We do not recommend any particular stocks. If particular stocks of such are mentioned, they are meant as demonstration of Amibroker as a powerful charting software and MACD. Amibroker can program to scan the stocks for buy and sell signals.
These are script generated signals. Not all scan results are shown here. The MACD signal should use with price action. Users must understand what MACD and price action are all about before using them. If necessary you should attend a course to learn more on Technical Analysis (TA) and Moving Average Convergence Divergence, MACD.
Once again, the website does not guarantee any results or investment return based on the information and instruction you have read here. It should be used as learning aids only and if you decide to trade real money, all trading decision should be your own.