January 11, 2018
We have done a correlation for the local three banks, DBS, UOB and OCBC. Let’s cross examine OCBC bank and see how to plan for 2018 trade.
Singapore Stock Analysis
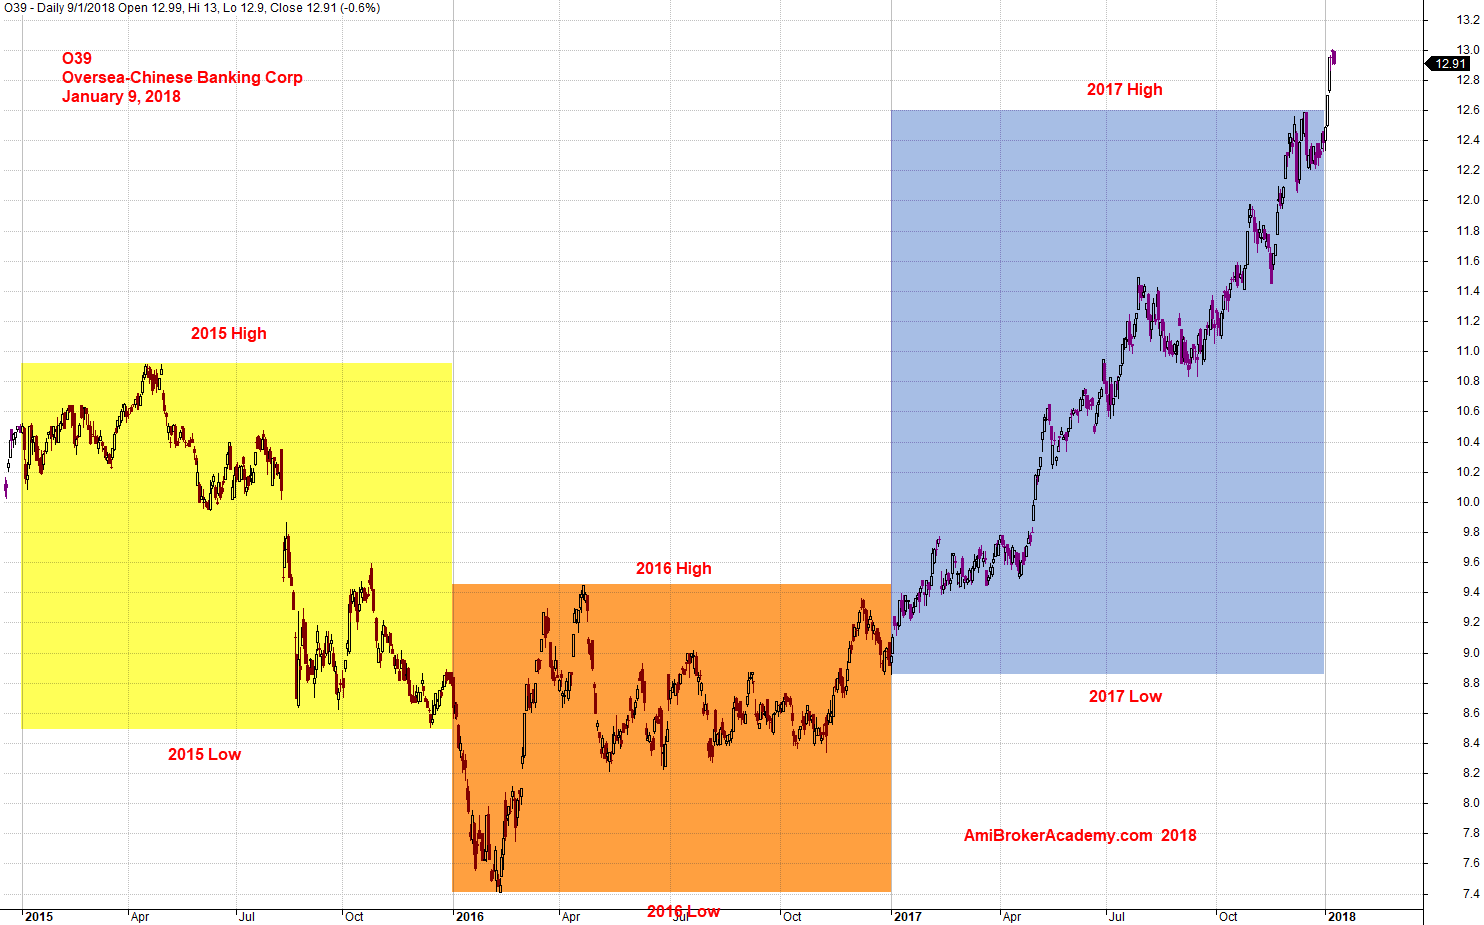
O39 Oversea-Chinese Banking Corporation OCBC Year High Low
The stock touch 13 in just a few days into 2018, if you look left and you will see 2016 year high is lower than 2015, and 2015 high is lower than 2017 high. So, 2017 is most bullish in the last three years for OCBS. Even the price stop moving higher for 2018, it will still be higher than 2017 high. Wow! What a great start for OCBC. See chart for more.
Powerful Chart Software – AmiBroker
The following chart is produced using AmiBroker charting software. It is a powerful chart software. You plot the stocks you are interested all in one chart, as long as you still could read them. See chart below.
January 9, 2018 Oversea-Chinese Banking Corporation and Year High Low
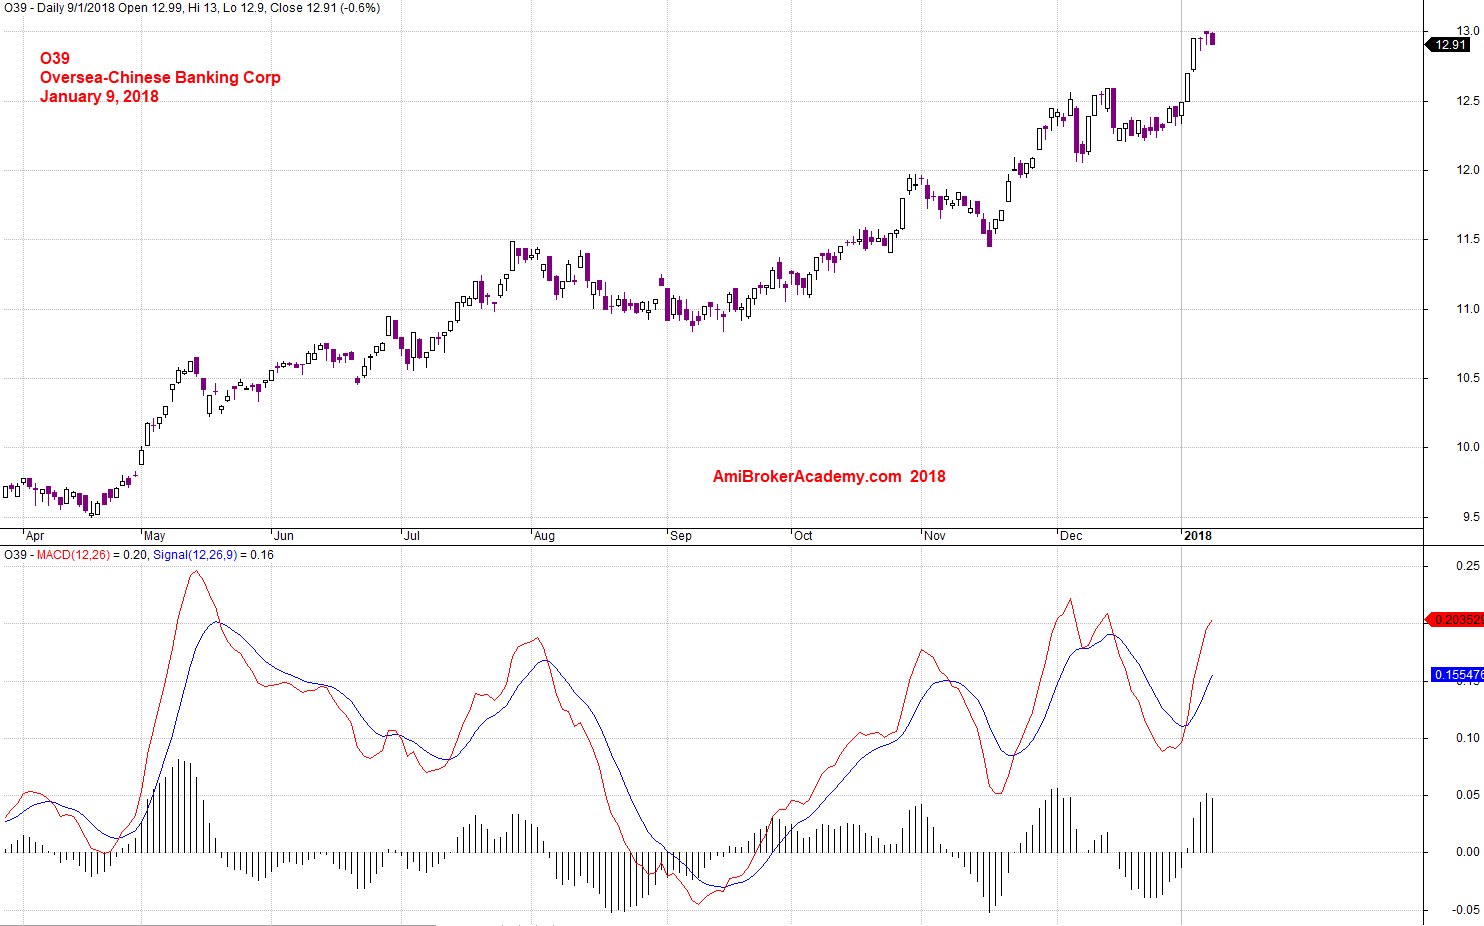
OCBC Bank and MACD
MACD signal is similar to DBS Group Holdings Stock, MACD cross up signal with MACD Histogram above zeroline. MACD signals is also above zeroline since last year mid September.
MACD is a great trend indicator. What have you got from the chart below. At least bullish for now.
January 9, 2018 Oversea-Chinese Banking Corporation OCBC and MACD
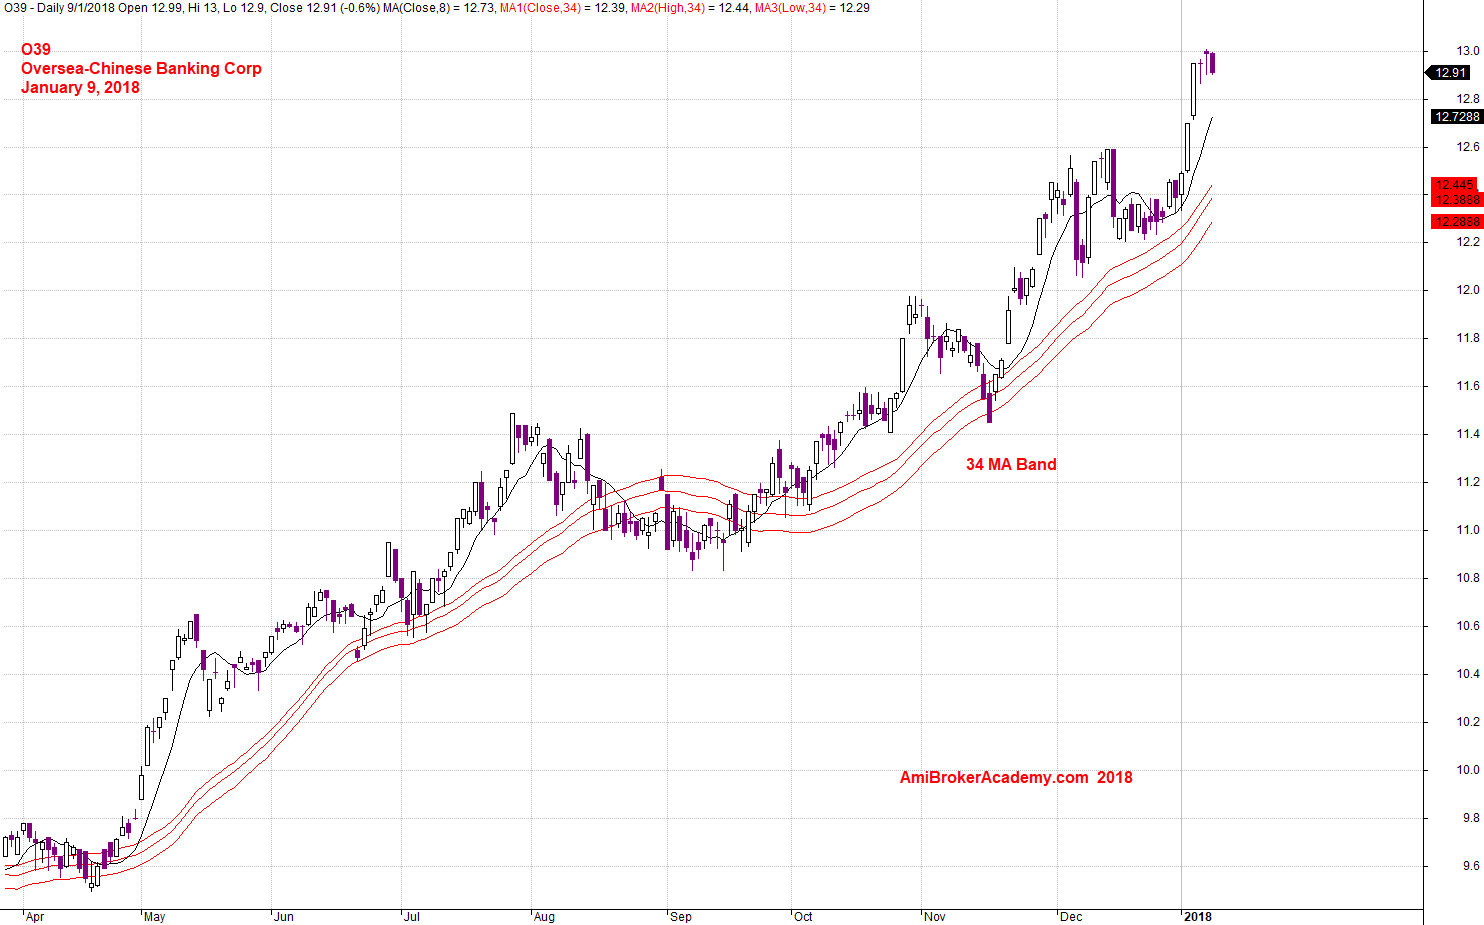
O39 OCBC Oversea-Chinese Banking Corporation and MA Band
MA slopping up bullish, MA slopping down bearish. Currently the MA Band is slopping up, the trend is bullish. Remember the price action is always bounce and pullback to the MA. So, after the price action bounce up from MA, it will pullback before it bounce up again. So, see chart the price action may be ready to pullback before bouncing again.
Next, remember setup can, in fact all set can fail. Therefore, the pullback can fail to be supported by the MA. Manage your risk.
January 9, 2018 OCBC Bank and MA Band
Moses
AmiBrokerAcademy.com
Disclaimer
The above result is for illustration purpose. It is not meant to be used for buy or sell decision. We do not recommend any particular stocks. If particular stocks of such are mentioned, they are meant as demonstration of Amibroker as a powerful charting software and MACD. Amibroker can program to scan the stocks for buy and sell signals.
These are script generated signals. Not all scan results are shown here. The MACD signal should use with price action. Users must understand what MACD and price action are all about before using them. If necessary you should attend a course to learn more on Technical Analysis (TA) and Moving Average Convergence Divergence, MACD.
Once again, the website does not guarantee any results or investment return based on the information and instruction you have read here. It should be used as learning aids only and if you decide to trade real money, all trading decision should be your own.