2 November, 2019
Welcome to AmiBrokerAcademy.com.
Remember all setup can fail. What you read now is a technical analysis, if you are not familiar with TA please moves on. TA used to project the future price action movement, look left and think right.
^STI Straits Times Index Stock Chart
Study Straits Times Index stock chart and Wave.
Look left and think right. Be careful what you ask for!
See chart, picture worth a thousand words.
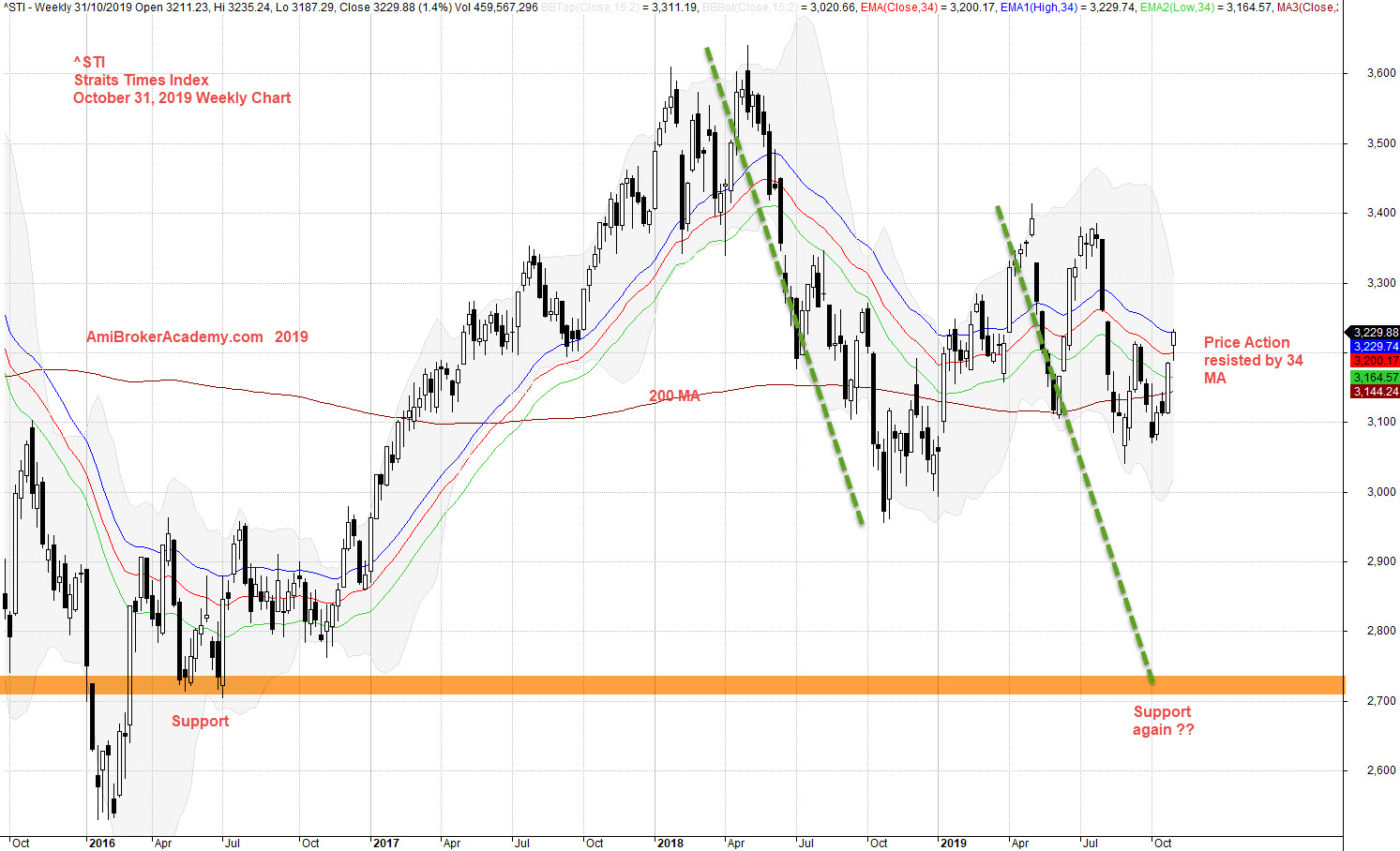
Moving Average is a great visual tool for price action bull and bear trend analysis. See chart price action goes from below wave to above and goes below again. Price Action resisted by the wave.
If the market emotion continue to be weak. The test of 2700 level or lower are all possible. But when? Don’t know.
H M Gartley pattern is a powerful observation. See chart, price action has completed the AB and BC leg, now the price action are waiting to complete the CD leg. Now be careful, there is a much bigger ABCD pattern, it is also in the CD leg. Can you see it? From the Low to the high, the AB leg, the high to the new low, is the BC leg. Now the price action maybe taking the support near 3000 level to start the CD leg.
Not easy. Don’t play play.
Trade with eyes open.
Moses Stock Observation
AmiBrokerAcademy.com
Disclaimer
The above result is for illustration purpose. It is not meant to be used for buy or sell decision. We do not recommend any particular stocks. If particular stocks of such are mentioned, they are meant as demonstration of Amibroker as a powerful charting software and MACD. Amibroker can program to scan the stocks for buy and sell signals.
These are script generated signals. Not all scan results are shown here. The MACD signal should use with price action. Users must understand what MACD and price action are all about before using them. If necessary you should attend a course to learn more on Technical Analysis (TA) and Moving Average Convergence Divergence, MACD.
Once again, the website does not guarantee any results or investment return based on the information and instruction you have read here. It should be used as learning aids only and if you decide to trade real money, all trading decision should be your own.